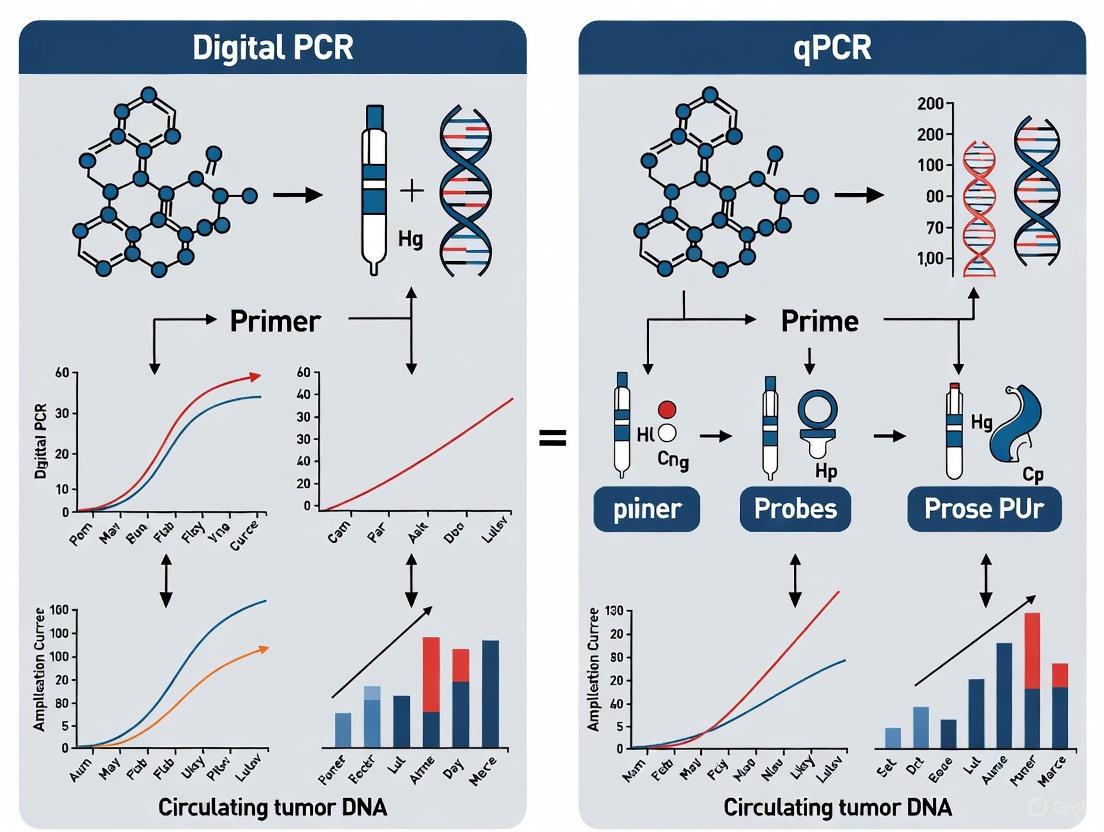
Digital PCR vs. qPCR for ctDNA Detection: A Guide to Precision, Sensitivity, and Clinical Application
This article provides a comprehensive comparison of Digital PCR (dPCR) and Real-Time PCR (qPCR) for the detection and analysis of circulating tumor DNA (ctDNA), a critical biomarker in liquid biopsies.
Digital PCR vs. qPCR for ctDNA Detection: A Guide to Precision, Sensitivity, and Clinical Application
Abstract
This article provides a comprehensive comparison of Digital PCR (dPCR) and Real-Time PCR (qPCR) for the detection and analysis of circulating tumor DNA (ctDNA), a critical biomarker in liquid biopsies. Tailored for researchers, scientists, and drug development professionals, it covers foundational principles, methodological workflows, and direct performance comparisons from recent studies. The content explores key applications in treatment monitoring and minimal residual disease (MRD) detection, offers practical troubleshooting advice, and synthesizes validation data to guide technology selection for specific research and clinical objectives in precision oncology.
Understanding ctDNA and PCR Technologies: Core Principles for Liquid Biopsies
Circulating tumor DNA (ctDNA) refers to small fragments of tumor-derived DNA found in the bloodstream, released through apoptosis or necrosis of cancer cells [1]. These fragments carry tumor-specific characteristics, including somatic mutations, making them valuable, minimally invasive biomarkers for cancer detection, monitoring, and treatment selection [1] [2]. In precision oncology, the analysis of ctDNA via liquid biopsy provides a dynamic snapshot of tumor burden and heterogeneity, enabling real-time monitoring of treatment response and disease progression [1] [3].
The detection and accurate quantification of ctDNA present significant technical challenges due to its low abundance in plasma, especially in early-stage disease, where it can constitute less than 0.1% of total cell-free DNA [4] [1]. This has driven the development of highly sensitive molecular techniques, primarily quantitative real-time PCR (qPCR) and digital PCR (dPCR), each with distinct advantages for ctDNA analysis [5] [2]. While qPCR is a well-established, high-throughput method for relative quantification, dPCR offers absolute quantification without the need for standard curves, providing superior sensitivity and precision for detecting low-frequency mutations [6] [5]. This application note details experimental protocols and provides a comparative analysis of these two pivotal technologies in ctDNA research.
Comparative Performance of dPCR and qPCR for ctDNA Analysis
The choice between dPCR and qPCR is critical and depends on the specific application requirements. The table below summarizes their key characteristics relevant to ctDNA detection.
Table 1: Key Technical Comparisons between dPCR and qPCR for ctDNA Analysis
| Parameter | Digital PCR (dPCR) | Quantitative Real-Time PCR (qPCR) |
|---|---|---|
| Principle of Quantification | Absolute, based on direct counting of target molecules [5] | Relative, requires a standard curve [5] |
| Sensitivity for Rare Targets | Excellent; partitions and enriches low-abundance targets [5] | Limited; difficult to detect rare mutations in a high background [5] |
| Precision | High precision, particularly at low concentrations [6] [5] | Good precision, but lower than dPCR for low-abundance targets [6] |
| Dynamic Range | Narrower [5] | Wide (6-7 orders of magnitude) [5] |
| Tolerance to PCR Inhibitors | High; partitioning minimizes inhibitor effects [5] | Sensitive; inhibitors can reduce amplification efficiency [5] |
| Throughput | Lower | High (96- or 384-well formats) [5] |
| Cost Per Reaction | Higher [5] | Lower [5] |
| Ideal ctDNA Application | Detection of low-frequency mutations (<0.5% VAF), MRD, low-shedding tumors [4] [5] | High-throughput screening, monitoring high VAF mutations, gene expression [5] |
The superior sensitivity of dPCR is particularly valuable for detecting minimal residual disease (MRD) and mutations at low variant allele frequencies (VAF). A multi-site evaluation of ctDNA assays found that while mutations above 0.5% VAF were detected with high sensitivity by all leading assays, performance below this limit became unreliable and varied widely, with false negatives being a common challenge [4]. Furthermore, a meta-analysis on circulating tumor HPV DNA (ctHPVDNA) demonstrated that detection sensitivity was greatest with NGS, followed by dPCR (ddPCR), and then qPCR, highlighting dPCR's intermediate position in the sensitivity hierarchy [7].
Detailed Experimental Protocols
Protocol: Blood Collection and Plasma Processing for ctDNA Analysis
Principle: To obtain high-quality, cell-free plasma with maximal yield and integrity of ctDNA, minimizing contamination from genomic DNA of blood cells [8].
Workflow Diagram: Plasma and ctDNA Isolation
Materials & Reagents:
- Blood Collection Tubes: Cell-free DNA BCT tubes (Streck), K2EDTA or K3EDTA tubes [3].
- Centrifuges: Swing-bucket centrifuge capable of 2,000 x g and high-speed microcentrifuge capable of 16,000 x g.
- Pipettes and Sterile Tips.
- Polypropylene Tubes: Low DNA binding, sterile.
- DNA Extraction Kit: QIAamp DNA Blood Mini Kit (Qiagen) or QIAamp Circulating Nucleic Acid Kit (Qiagen) [6] [3].
- Quantification Instrument: Fluorometer (e.g., Qubit, Thermo Fisher Scientific).
Procedure:
- Blood Draw: Collect venous blood into approved cell-free DNA blood collection tubes. Invert gently 8-10 times. Process within 1-4 hours if using EDTA tubes; specialized BCT tubes can stabilize blood for several days at room temperature.
- First Centrifugation: Centrifuge blood tubes at 1,600-2,000 x g for 10 minutes at 4°C to separate plasma from blood cells.
- Plasma Transfer: Carefully transfer the upper plasma layer to a new microcentrifuge tube using a sterile pipette, avoiding the buffy coat (white cell layer).
- Second Centrifugation: Centrifuge the transferred plasma at 16,000 x g for 10 minutes at 4°C to remove any remaining cellular debris.
- Cleared Plasma Transfer: Transfer the supernatant (cleared plasma) to a new, labeled microcentrifuge tube. Plasma can be stored at -80°C or used immediately for DNA extraction.
- cfDNA Extraction: Extract cfDNA from plasma (typically 1-5 mL) using a commercial kit (e.g., QIAamp DNA Mini kit) according to the manufacturer's instructions [6]. Elute DNA in a small volume (e.g., 20-50 µL) of nuclease-free water or the provided elution buffer.
- Quantification and QC: Quantify the extracted cfDNA using a fluorescence-based method (e.g., Qubit dsDNA HS Assay). Assess DNA fragment size distribution using a Bioanalyzer or TapeStation if available.
Protocol: Detection of a Point Mutation via dPCR
Principle: The sample is partitioned into thousands of nanoliter-scale reactions. Following endpoint PCR amplification, each partition is analyzed for fluorescence to absolutely quantify the mutant and wild-type alleles based on Poisson statistics [5].
Workflow Diagram: dPCR Mutation Detection
Materials & Reagents:
- dPCR System: QIAcuity (Qiagen), Bio-Rad QX200 Droplet Digital PCR, or similar.
- dPCR Supermix: QIAcuity Probe PCR Kit (Qiagen) or ddPCR Supermix for Probes (Bio-Rad) [6].
- Primers and Probes: Validated, specific primers and double-quenched hydrolysis probes (e.g., FAM-labeled for mutant allele, HEX/VIC-labeled for wild-type allele) [6].
- Restriction Enzyme: PvuII or similar (optional, to reduce background) [6].
- Nuclease-Free Water.
- Plate or Cartridge: As required by the dPCR instrument (e.g., QIAcuity Nanoplate 26k).
Procedure:
- Reaction Setup: Prepare a 40 µL dPCR reaction mix on ice containing:
- 1x dPCR Supermix
- 900 nM of each primer (final concentration)
- 250 nM of each probe (final concentration)
- 10 µL of extracted cfDNA template
- 0.025 U/µL restriction enzyme (if using)
- Nuclease-free water to volume
- Partitioning: Load the reaction mixture into the dPCR plate or cartridge and perform partitioning according to the manufacturer's protocol (e.g., generating ~20,000 droplets for ddPCR or ~26,000 partitions for the QIAcuity nanoplate system) [6].
- PCR Amplification: Run the PCR with the following optimized cycling conditions:
- Enzyme Activation: 95°C for 2 minutes
- 45 Cycles of:
- Denaturation: 95°C for 15 seconds
- Annealing/Extension: 58-60°C for 1 minute
- Hold: 4°C or 98°C (for seal integrity)
- Fluorescence Reading: After amplification, place the plate/cartridge in the reader to measure the fluorescence in each partition.
- Data Analysis: Use the instrument's software (e.g., QIAcuity Software Suite) to set thresholds and classify partitions as mutant-positive, wild-type-positive, double-positive, or negative. The software will automatically apply Poisson statistics to calculate the absolute concentration (copies/µL) of the mutant and wild-type alleles in the original sample [6]. Calculate the variant allele frequency (VAF) as [Mutant concentration / (Mutant + Wild-type concentration)].
Protocol: Relative Quantification of a Genetic Alteration via qPCR
Principle: Fluorescence accumulation is monitored during each PCR cycle. The cycle threshold (Ct) at which fluorescence crosses a defined threshold is inversely proportional to the starting quantity of the target, which is determined by comparison to a standard curve [5].
Materials & Reagents:
- qPCR Instrument: Any real-time PCR system (e.g., from Applied Biosystems, Bio-Rad, Roche).
- qPCR Master Mix: TaqMan Universal PCR Master Mix or equivalent.
- Primers and Probes: As designed for the target mutation and a reference control gene.
- DNA Standards: Serial dilutions of synthetic oligonucleotides or plasmid DNA with known concentrations of the wild-type and mutant sequences.
- Microplate or Strips: 96-well or 384-well optical reaction plates.
Procedure:
- Standard Curve Preparation: Prepare a 5- to 10-fold serial dilution of the standard DNA, spanning the expected concentration range of the target in the samples (e.g., from 10^6 to 10^1 copies/µL).
- Reaction Setup: Prepare a 20 µL qPCR reaction mix per well containing:
- 1x TaqMan Universal PCR Master Mix
- 900 nM of each primer
- 250 nM of probe
- 5 µL of cfDNA template (for samples) or standard
- Nuclease-free water to volume
- Amplification: Run the plate in the qPCR instrument with the following standard cycling conditions:
- Enzyme Activation: 50°C for 2 minutes (UDG incubation, if used) and 95°C for 10 minutes
- 40-45 Cycles of:
- Denaturation: 95°C for 15 seconds
- Annealing/Extension: 60°C for 1 minute
- Data Analysis:
- The instrument's software will generate amplification plots and assign Ct values to each reaction.
- Generate a standard curve by plotting the Ct values of the standards against the logarithm of their known concentrations. The efficiency (E) of the PCR can be calculated from the slope of the standard curve: E = 10^(-1/slope) - 1.
- Use the standard curve equation to interpolate the starting quantity of the target in each unknown sample. Results are often reported as relative quantities after normalization to a reference gene.
The Scientist's Toolkit: Research Reagent Solutions
Table 2: Essential Reagents and Kits for ctDNA Detection via dPCR/qPCR
| Reagent/Kits | Primary Function | Example Products & Comments |
|---|---|---|
| Cell-free DNA Blood Collection Tubes | Stabilize blood cells and prevent genomic DNA contamination for up to 14 days. | Streck Cell-Free DNA BCT Tubes, PAXgene Blood cDNA Tubes [3]. |
| Nucleic Acid Extraction Kits | Isolate and purify cfDNA from plasma or serum. | QIAamp DNA Blood Mini Kit (Qiagen), QIAamp Circulating Nucleic Acid Kit (Qiagen) [6] [3]. |
| dPCR Master Mixes | Provide optimized buffers, nucleotides, and enzyme for partitioned PCR. | QIAcuity Probe PCR Kit (Qiagen), ddPCR Supermix for Probes (Bio-Rad) [6]. |
| qPCR Master Mixes | Provide optimized components for real-time fluorescent PCR. | TaqMan Universal PCR Master Mix (Thermo Fisher). |
| Assay Design Tools | In silico design and validation of primers and probes. | Primer-BLAST (NCBI), Bio-Rad ddPCR Assay Design Tool. |
| Validated Assays | Pre-designed and tested assays for common oncogenic mutations. | Bio-Rad ddPCR Mutation Assays, Thermo Fisher TaqMan Mutation Assays. |
| Fluorometers & Analyzers | Accurately quantify and qualify low-concentration, fragmented DNA. | Qubit Fluorometer (Thermo Fisher), Agilent Bioanalyzer. |
| Synthetic DNA Standards | Serve as positive controls and for generating standard curves in qPCR. | gBlocks Gene Fragments (IDT), custom synthetic oligonucleotides. |
The integration of ctDNA analysis into precision oncology represents a significant advancement in cancer management. Both dPCR and qPCR are powerful tools for ctDNA detection, yet they serve complementary roles. dPCR, with its absolute quantification, superior sensitivity for low-frequency mutations, and robustness to inhibitors, is ideally suited for applications like MRD detection and validating mutations identified by NGS [6] [5]. In contrast, qPCR remains a cost-effective and high-throughput solution for screening known mutations present at higher VAFs or for gene expression studies [5]. The ongoing refinement of these protocols and technologies will continue to enhance the sensitivity and reproducibility of ctDNA measurements, further solidifying its role as a dynamic biomarker in clinical research and therapeutic decision-making.
The polymerase chain reaction (PCR) has undergone a transformative evolution since its inception, moving from qualitative endpoint detection to sophisticated quantitative methodologies. Quantitative real-time PCR (qPCR) emerged as a revolutionary technology that enabled researchers to monitor amplification as it occurred, providing relative quantification of nucleic acid targets across a wide dynamic range. This technique became the workhorse of molecular biology laboratories, supporting applications from gene expression analysis to pathogen detection. However, its reliance on calibration curves and its susceptibility to amplification inefficiencies revealed inherent limitations, particularly for applications requiring absolute quantification or detection of rare targets [9].
The development of digital PCR (dPCR) represents the latest paradigm shift in nucleic acid quantification. By combining limiting dilution, endpoint PCR, and Poisson statistics, dPCR enables absolute quantification of target molecules without requiring standard curves [10]. This technical advancement has proven particularly valuable for detecting minor genetic variants against a background of wild-type sequences—a common challenge in circulating tumor DNA (ctDNA) detection where tumor-derived DNA fragments may represent less than 0.1% of total cell-free DNA [10]. As molecular diagnostics continues to advance toward more precise quantification, understanding the technological evolution from qPCR to dPCR becomes essential for researchers designing next-generation liquid biopsy assays.
Technical Principles: Fundamental Differences Between qPCR and dPCR
qPCR: Relative Quantification Based on Amplification Kinetics
In qPCR, the accumulation of PCR product is monitored in real-time through fluorescent chemistry, with the quantification cycle (Cq) representing the cycle number at which fluorescence exceeds a detection threshold. Target concentration is determined by comparing the Cq values of unknown samples to those of a standard curve with known concentrations [9]. This approach provides relative quantification across a linear dynamic range typically spanning 5-6 orders of magnitude. The technique relies on the assumption that amplification efficiency remains constant between samples and standards, which can be compromised by PCR inhibitors or suboptimal reaction conditions [11].
The MIQE guidelines were established to standardize qPCR experiments and publications, emphasizing the need for detailed reporting of experimental conditions, including nucleic acid extraction methods, target information, amplification efficiency, and normalization strategies [12]. Despite these guidelines, compliance remains inconsistent, leading to concerns about reproducibility in the literature. Common limitations include inadequate validation of reference genes, unreported PCR efficiency calculations, and inappropriate statistical justification [12].
dPCR: Absolute Quantification Through Sample Partitioning
Digital PCR takes a fundamentally different approach by dividing a PCR reaction into thousands to millions of separate partitions, effectively creating a matrix of individual PCR reactions. After endpoint amplification, each partition is analyzed as positive or negative for target amplification, with the ratio of positive to total partitions enabling absolute quantification of the target molecule based on Poisson statistics [13] [10].
This partitioning approach provides several distinctive advantages. First, it eliminates the dependency on external standards and amplification efficiency, as quantification depends solely on binary endpoint detection. Second, it significantly enhances resistance to PCR inhibitors, as the effect is diluted across partitions rather than affecting the bulk reaction. Third, it dramatically improves precision and sensitivity for rare allele detection, enabling identification of mutant alleles present at frequencies as low as 0.001% in a background of wild-type sequences [10].
Table 1: Core Technical Differences Between qPCR and dPCR
| Parameter | qPCR | dPCR |
|---|---|---|
| Quantification Type | Relative (requires standard curve) | Absolute (no standard curve needed) |
| Detection Principle | Real-time fluorescence monitoring | Endpoint binary detection (positive/negative partitions) |
| Dynamic Range | 5-6 logs | 4-5 logs |
| Precision | Distinguishes ~1.5-fold changes | Distinguishes ~1.2-fold changes |
| Susceptibility to Inhibitors | Moderate to high | Low |
| Multiplexing Capability | High (with spectral resolution) | Moderate (limited by partition number) |
| Throughput | High | Moderate |
| Cost per Sample | Low | High |
Comparative Performance: Analytical Validation Across Applications
Sensitivity and Precision
Multiple studies have demonstrated the superior sensitivity and precision of dPCR, particularly at target concentrations where qPCR begins to lose linearity. In viral load testing, dPCR has shown less variability at higher concentrations for WHO international standards compared to qPCR [11]. A 2025 study comparing respiratory virus detection reported that dPCR demonstrated "superior accuracy, particularly for high viral loads of influenza A, influenza B, and SARS-CoV-2, and for medium loads of RSV" with "greater consistency and precision than Real-Time RT-PCR" [14].
The enhanced precision of dPCR enables more reliable detection of small-fold changes, with studies reporting the ability to distinguish 1.2-fold differences in target concentration compared to 1.5-fold changes typically detectable by qPCR [10]. This heightened sensitivity is particularly valuable in ctDNA monitoring, where small changes in mutant allele frequency may indicate early treatment response or emerging resistance.
Limits of Detection and Quantification
The limit of detection (LOD) and limit of quantification (LOQ) represent critical performance parameters for ctDNA analysis. In a comparative study of dPCR platforms, the LOD for nanoplate-based dPCR was approximately 0.39 copies/μL input, while droplet-based dPCR showed an LOD of 0.17 copies/μL input [13]. The LOQ was determined to be 1.35 copies/μL input for the nanoplate system and 4.26 copies/μL input for the droplet system [13].
For SARS-CoV-2 detection, studies have demonstrated that dPCR provides enhanced sensitivity compared to qPCR, particularly in samples with low viral load where it detected additional positive cases missed by qPCR [15]. This improved detection capability directly translates to ctDNA applications, where tumor-derived DNA fragments often exist at extremely low concentrations amidst abundant wild-type DNA.
Table 2: Performance Comparison Across PCR Platforms in Recent Studies
| Study | Target | qPCR Performance | dPCR Performance |
|---|---|---|---|
| Suo et al. 2022 [15] | SARS-CoV-2 | 89/130 positive samples | 93/130 positive samples |
| Zhang et al. 2025 [14] | Respiratory viruses | Variable quantification across viral load ranges | Superior accuracy for high viral loads |
| Platform Comparison 2025 [13] | Synthetic oligonucleotides | Not tested | R²adj = 0.98-0.99, CV: 6-13% |
| Hayden et al. 2013 [11] | Cytomegalovirus | LOD: 3 log₁₀ copies/mL | LOD: 4 log₁₀ copies/mL |
Application to ctDNA Detection: Technical Considerations and Protocols
Sample Preparation and Pre-Analytical Variables
For ctDNA analysis, proper sample handling is critical. Blood collection should utilize specialized tubes that stabilize nucleated blood cells and prevent genomic DNA contamination. Plasma separation should occur within 2-6 hours of collection, followed by double centrifugation to remove residual cells. DNA extraction should employ optimized kits specifically designed for low-abundance cell-free DNA, with careful attention to elution volume to maximize concentration [14] [15].
The quality and integrity of extracted nucleic acids should be thoroughly assessed using appropriate methods. The MIQE 2.0 guidelines emphasize that "nucleic acid quality and integrity are not properly assessed" in many studies, representing a fundamental methodological failure that can compromise ctDNA detection [12].
dPCR Assay Design and Optimization for Rare Allele Detection
Effective ctDNA detection requires careful assay design to maximize specificity and sensitivity. Assays should be designed with short amplicon lengths (60-100 bp) to accommodate the fragmented nature of cell-free DNA. Probes should be positioned to cover the mutation of interest, with stringent bioinformatic analysis to ensure specificity.
Restriction enzyme selection can significantly impact assay performance, especially for targets with potential tandem repeats. A 2025 study demonstrated that "CVs were higher for ddPCR compared to ndPCR for all cell numbers except 100 cells for the assay using EcoRI," while "using HaeIII as a restriction enzyme, the overall precision was increased for ddPCR with all CVs lower than 5%" [13]. This highlights the importance of enzyme selection during assay optimization.
Detailed dPCR Protocol for ctDNA Detection
Protocol: Rare Mutation Detection in Cell-Free DNA Using dPCR
Reagents and Equipment:
- QIAcuity One digital PCR system (QIAGEN) or QX200 Droplet Digital PCR System (Bio-Rad)
- dPCR Master Mix (probe-based)
- Mutation-specific FAM-labeled probe and wild-type HEX-labeled probe
- Restriction enzyme (HaeIII or alternative optimized for target)
- Nuclease-free water
- PCR plates or cartridges compatible with platform
Procedure:
- Reaction Mixture Preparation:
- Prepare master mix containing 11 μL dPCR supermix, 1.1 μL of each primer (900 nM final concentration), 0.5 μL of each probe (250 nM final concentration), 1 U restriction enzyme, and 5 μL template DNA in a total volume of 20-25 μL depending on platform specifications.
- Include negative controls (nuclease-free water) and positive controls (synthetic oligonucleotides with known mutation frequency).
Partitioning:
- For nanoplate systems: Load entire reaction volume into appropriate well(s).
- For droplet systems: Generate droplets according to manufacturer's protocol using droplet generation oil and cartridges.
PCR Amplification:
- Perform endpoint PCR with the following cycling conditions:
- Enzyme activation: 95°C for 10 minutes
- 40-45 cycles of:
- Denaturation: 95°C for 30 seconds
- Annealing/Extension: 55-60°C for 60 seconds
- Enzyme deactivation: 98°C for 10 minutes
- Hold: 4-12°C
- Perform endpoint PCR with the following cycling conditions:
Signal Detection and Analysis:
- For nanoplate systems: Image each well using integrated imaging system.
- For droplet systems: Read droplets using droplet reader.
- Analyze using manufacturer's software with appropriate threshold settings.
- Apply Poisson correction to calculate absolute copy numbers.
Data Interpretation:
- Calculate mutant allele frequency as (mutant copies / total copies) × 100.
- Report confidence intervals based on Poisson statistics.
- For longitudinal monitoring, calculate fold-change relative to baseline.
Research Reagent Solutions for ctDNA Analysis
Table 3: Essential Reagents and Kits for dPCR-based ctDNA Detection
| Reagent Category | Specific Examples | Function in ctDNA Analysis |
|---|---|---|
| Blood Collection Tubes | Cell-Free DNA Blood Collection Tubes (Roche, Streck) | Preserves blood sample integrity and prevents background DNA release |
| Nucleic Acid Extraction Kits | MagMax Viral/Pathogen Kit, QIAamp Circulating Nucleic Acid Kit | Isolates low-abundance cell-free DNA with high efficiency and reproducibility |
| dPCR Master Mixes | ddPCR Supermix for Probes (Bio-Rad), QIAcuity PCR Master Mix (QIAGEN) | Provides optimized reaction components for partition-based amplification |
| Mutation Detection Assays | Custom TaqMan SNP Genotyping Assays, PrimePCR dPCR Mutation Assays | Enables specific detection of tumor-specific mutations against wild-type background |
| Reference Assays | Copy Number Reference Assays, Reference Gene Assays | Normalizes for technical variation in DNA input and partitioning efficiency |
| Quantification Standards | Synthetic Oligonucleotides, gBlocks Gene Fragments | Validates assay performance and establishes limits of detection |
Implementation Workflows and Data Analysis
Experimental Workflow for ctDNA Analysis
The following diagram illustrates the complete workflow for ctDNA analysis using dPCR, highlighting critical decision points from sample collection through data interpretation:
Data Analysis Framework
Proper data analysis is essential for accurate ctDNA quantification. The application of Poisson statistics corrects for the probability of multiple target molecules occupying a single partition. Quality thresholds should be established to exclude partitions with ambiguous signals, and replicate testing should be implemented for clinical applications.
For longitudinal monitoring, statistical significance should be established based on the confidence intervals provided by dPCR analysis rather than simple fold-change calculations. The MIQE 2.0 guidelines emphasize that "fold-changes of 1.2- or 1.5-fold are routinely reported as biologically meaningful, even at low expression levels, without any assessment of measurement uncertainty or technical variance" [12], highlighting the importance of appropriate statistical treatment.
The evolution from qPCR to dPCR represents a significant advancement in nucleic acid quantification technology, with particular relevance for ctDNA detection in oncology. While qPCR remains a cost-effective solution for high-throughput applications with moderate sensitivity requirements, dPCR offers distinct advantages for absolute quantification, rare allele detection, and analysis of samples with potential inhibitors.
The higher cost and lower throughput of dPCR currently limit its implementation in routine screening, but its superior precision and sensitivity make it ideally suited for monitoring minimal residual disease and treatment response in cancer patients [9] [14]. As the technology continues to evolve with increased automation and reduced costs, dPCR is poised to become an increasingly essential tool in the liquid biopsy arsenal, potentially enabling earlier cancer detection and more personalized treatment approaches.
For researchers implementing dPCR for ctDNA applications, adherence to the dMIQE guidelines ensures methodological rigor, while careful attention to pre-analytical variables and assay optimization maximizes the technology's considerable potential for transforming cancer diagnostics and monitoring.
Quantitative PCR (qPCR), also known as real-time PCR, represents a fundamental advancement in molecular biology by enabling precise quantification of nucleic acids throughout the amplification process rather than just at the end. This technique relies on detecting fluorescent signals that increase proportionally to the amount of PCR product generated in each cycle. For research on circulating tumor DNA (ctDNA)—where detecting minute genetic changes in a complex background is critical—qPCR offers a balance of sensitivity, throughput, and accessibility.
The fluorescence detection system in qPCR consists of four essential components: (1) an excitation light source, (2) a fluorescent reporter dye, (3) wavelength-specific filters to separate emission photons from excitation photons, and (4) a detector that records the emission signal [16]. This configuration takes advantage of the fundamental fluorescence process where light energy at a specific wavelength is absorbed by a fluorophore, creating an excited electronic state, followed by emission of light at a longer wavelength as the fluorophore returns to its ground state. The difference between excitation and emission wavelengths, known as the Stokes shift, is crucial for sensitive detection as it enables separation of the signal from background noise [16].
In ctDNA research, this sensitive detection capability allows researchers to identify and quantify specific tumor-derived mutations present at low frequencies in patient blood samples, providing a non-invasive method for monitoring cancer progression and treatment response.
Principles of Fluorescence Detection in qPCR
Fluorescence Chemistry and Detection Systems
The core principle of qPCR detection relies on measuring fluorescence intensity that correlates directly with accumulated PCR product. Two primary fluorescence detection chemistries are employed in qPCR:
DNA-Binding Dyes: SYBR Green is the most common example, which fluoresces brightly when bound to double-stranded DNA. As PCR product accumulates with each cycle, more dye molecules bind and the fluorescent signal increases proportionally. While cost-effective and flexible, these dyes bind non-specifically to any double-stranded DNA, including primer-dimers, potentially leading to overestimated target concentration.
Sequence-Specific Probes: The 5' nuclease assay (TaqMan) uses dual-labeled probes containing a 5' fluorophore and a 3' quencher. When intact, the proximity of quencher to fluorophore prevents fluorescence detection through fluorescence resonance energy transfer (FRET). During PCR amplification, the DNA polymerase's 5'→3' exonuclease activity cleaves the probe, separating the fluorophore from the quencher and generating a fluorescent signal [17]. This mechanism ensures that fluorescence increase specifically indicates amplification of the target sequence, making it particularly valuable for detecting specific mutations in ctDNA analysis.
Instrumentation and Signal Processing
qPCR instruments must precisely control temperature cycling while simultaneously exciting fluorophores and detecting emission signals across multiple wavelengths. Modern instruments typically include several detection channels, allowing simultaneous measurement of different fluorophores in multiplex reactions—a critical capability for detecting multiple mutations or normalizing to reference genes in ctDNA studies.
Proper signal processing requires careful setup of two key parameters that significantly impact data quality and quantification accuracy. The baseline fluorescence represents background signal during initial PCR cycles before detectable product accumulation, while the threshold is set within the exponential phase where reaction efficiency is optimal [18]. The cycle at which each sample's amplification curve crosses this threshold (Cq or Ct value) forms the basis for quantification.
Table 1: Critical Fluorescence Detection Parameters in qPCR
| Parameter | Definition | Optimal Setup | Impact on Quantification |
|---|---|---|---|
| Baseline | Background fluorescence during initial cycles | Set from cycles where fluorescence is stable but above background | Incorrect setting distorts Cq values and curve shape |
| Threshold | Fluorescence level above background in exponential phase | Set within parallel, logarithmic phase of all amplifications | Affects absolute Cq but not ΔCq if amplifications are parallel |
| Cq (Quantification Cycle) | Cycle number at which fluorescence crosses threshold | Automatically or manually determined after baseline/threshold setup | Lower Cq indicates higher initial template concentration |
Relative Quantification Strategies in qPCR
Fundamentals of Relative Quantification
Relative quantification determines changes in gene expression by comparing the amount of target gene between test and reference samples, with normalization to one or more stably expressed reference genes. Unlike absolute quantification—which calculates exact copy numbers using a standard curve—relative quantification expresses results as fold-differences, making it particularly suitable for studying expression changes in response to experimental conditions or disease states [19].
In ctDNA research, relative quantification can be employed to assess ratio changes between mutant and wild-type alleles or to normalize ctDNA levels to reference genes, though absolute quantification is often preferred for precise mutation load assessment. The relative quantification framework consists of several key components:
- Target Gene: The sequence of interest (e.g., a tumor-specific mutation)
- Reference Gene(s): Stably expressed endogenous controls used for normalization (e.g., ACTB, GAPDH, HPRT)
- Calibrator Sample: A reference point for comparison (e.g., a control sample or pre-treatment time point)
- Experimental Samples: Test specimens compared against the calibrator
Mathematical Models for Relative Quantification
Two primary mathematical approaches dominate relative quantification in qPCR, each with specific applications and requirements.
Comparative Cq (ΔΔCq) Method: This approach assumes that amplification efficiencies of target and reference genes are approximately equal and close to 100% (meaning the PCR product doubles each cycle) [20]. The method involves:
- Calculating ΔCq for each sample: Cq(target) - Cq(reference)
- Calculating ΔΔCq: ΔCq(test sample) - ΔCq(calibrator sample)
- Determining fold-change: 2^(-ΔΔCq)
This method's simplicity makes it widely popular, but its accuracy depends heavily on the efficiency assumption [21]. Efficiency can be verified by ensuring the absolute value of the slope of ΔCq plotted against log input cDNA dilution is less than 0.1 [22].
Pfaffl (Efficiency-Corrected) Method: When amplification efficiencies of target and reference genes differ significantly (typically >5%), the Pfaffl method incorporates actual efficiency values into the calculation [20]:
[ \text{Fold Change} = \frac{(E{\text{target}})^{\Delta Cq{\text{target}}}}{(E{\text{reference}})^{\Delta Cq{\text{reference}}}} ]
Where E represents the amplification efficiency (1.0-2.0) calculated from standard curves, and ΔCq represents the difference in Cq values between calibrator and test samples for each gene [21]. This method provides more accurate results when efficiency differences exist but requires additional validation experiments.
Table 2: Comparison of Relative Quantification Methods
| Characteristic | Comparative Cq (ΔΔCq) Method | Pfaffl (Efficiency-Corrected) Method |
|---|---|---|
| Efficiency Assumption | Equal, near-perfect efficiencies for target and reference genes | Accommodates different efficiencies between genes |
| Standard Curve Requirement | Not required | Required for efficiency determination |
| Calculation Complexity | Simple calculation | More complex, efficiency-dependent formula |
| Accuracy Conditions | High accuracy when efficiency assumption valid | Superior accuracy when efficiencies differ |
| Validation Requirement | Must demonstrate similar efficiencies | Must determine precise efficiency values |
| Throughput | Higher - no standard curve wells needed | Lower - requires standard curve on each plate |
Experimental Protocol for Relative Quantification
Assay Design and Validation
Primer and Probe Design: Effective qPCR begins with careful assay design. For 5' nuclease assays, primers should have Tm values of approximately 60-62°C, length of 18-30 bases, and GC content of 35-65% without runs of more than 4 consecutive G bases [17]. The probe should have a Tm 5-10°C higher than primers, be ≤30 bases for optimal quenching, and avoid G at the 5' end which can quench common fluorophores like FAM [17]. For gene expression studies, design primers to span exon-exon junctions to prevent genomic DNA amplification.
Amplification Efficiency Determination: Before relative quantification, determine amplification efficiency for each primer pair:
- Prepare a 5-point, 10-fold serial dilution of cDNA pool
- Run qPCR with all dilutions in duplicate
- Plot Cq values against log template dilution
- Calculate slope and efficiency: E = 10^(-1/slope)
- Convert to percentage: % Efficiency = (E-1) × 100
Ideal reactions display efficiency of 90-110% (slope of -3.6 to -3.1) [20]. Efficiency outside this range typically requires primer redesign.
Experimental Setup and Controls
Reference Gene Selection: Reference genes must show stable expression across all experimental conditions. Validate candidate reference genes using algorithms like geNorm or NormFinder [20]. For ctDNA studies, select reference genes unaffected by the disease state or treatment.
Essential Experimental Controls:
- No-template controls (NTC): Identify contamination
- No-reverse-transcription controls (-RT): Detect genomic DNA contamination
- Inter-plate calibrators: Enable normalization across multiple runs
- Technical replicates: Minimum of three replicates per sample
qPCR Reaction Setup:
- Keep total reaction volume consistent across all wells
- Do not exceed 1/10 of total reaction volume with cDNA mixture
- Use validated master mix according to manufacturer's cycling conditions
- Include standard curve dilutions on each plate for efficiency-corrected methods
Application in Circulating Tumor DNA Research
qPCR for ctDNA Analysis
In ctDNA research, qPCR enables non-invasive "liquid biopsy" approaches for cancer monitoring, treatment selection, and recurrence detection. Specific applications include:
Mutation Detection: Target tumor-specific mutations (e.g., KRAS, EGFR, PIK3CA) using allele-specific qPCR assays. These assays typically use specialized primer/probe designs that preferentially amplify mutant alleles while suppressing wild-type amplification, enabling detection of mutant alleles at frequencies as low as 0.1-1% [23].
Expression Profiling: Quantify expression levels of cancer-associated genes (e.g., DNA methylation markers) in circulating nucleic acids. This requires careful normalization to reference genes that are stably expressed in blood and unaffected by the disease process.
Treatment Monitoring: Track mutation levels over time to assess therapeutic response. Decreasing mutant allele frequency typically indicates positive treatment response, while increasing levels may signal resistance or recurrence.
Comparison with Digital PCR for ctDNA Analysis
While qPCR provides a robust platform for ctDNA analysis, digital PCR (dPCR) offers complementary advantages for certain applications. dPCR partitions samples into thousands of individual reactions, enabling absolute quantification without standard curves and improved detection of rare variants [19]. Recent studies directly comparing these technologies found that droplet digital PCR (ddPCR) detected ctDNA in 58.5% of baseline plasma samples from rectal cancer patients compared to 36.6% with next-generation sequencing panels, demonstrating its high sensitivity for low-abundance targets [23].
For longitudinal monitoring, dPCR's precision enables detection of molecular recurrence months before clinical relapse, particularly valuable for monitoring minimal residual disease [24]. However, qPCR maintains advantages in throughput, multiplexing capability, and established workflows, making it suitable for screening applications or when absolute quantification is not required.
Table 3: Research Reagent Solutions for qPCR Relative Quantification
| Reagent Category | Specific Examples | Function in Experiment |
|---|---|---|
| Fluorescence Chemistries | SYBR Green, FAM/TAMRA probes, Molecular Beacons | Detect PCR product accumulation through fluorescence emission |
| Reverse Transcriptase | M-MLV, SuperScript IV | Convert RNA to cDNA for gene expression studies |
| qPCR Master Mix | TaqMan Fast Advanced, PowerUp SYBR Green | Provide optimized buffer, enzymes, dNTPs for efficient amplification |
| Reference Genes | ACTB, GAPDH, HPRT, 18S rRNA | Normalize for sample input variation in relative quantification |
| Nuclease-Free Water | Ambion Nuclease-Free Water | Prevent RNA/DNA degradation during reaction setup |
| Positive Controls | Synthetic DNA/RNA standards, Control plasmids | Verify assay performance and enable absolute quantification |
| Inhibition Relief Agents | BSA, T4 Gene 32 Protein | Counteract PCR inhibitors in complex biological samples |
Troubleshooting and Quality Control
Data Quality Assessment
Implement rigorous quality control measures to ensure reliable relative quantification results:
Amplification Curve Analysis: Check that all curves display characteristic sigmoidal shape with clear exponential phases. Irregular curves may indicate inhibition, poor primer design, or pipetting errors.
Amplification Efficiency: Confirm efficiencies between 90-110% for all assays. Significantly higher efficiencies may indicate primer-dimer formation, while lower efficiencies suggest inhibition or suboptimal reaction conditions.
Reference Gene Stability: Verify stable expression of reference genes across experimental conditions using algorithms like geNorm or NormFinder. Instability requires selection of alternative reference genes or use of multiple genes for normalization.
Reproducibility: Technical replicates should show minimal variation (Cq standard deviation < 0.5 cycles). Higher variation indicates technical issues with pipetting, mixing, or template quality.
Common Issues and Solutions
- High Background Fluorescence: Optimize probe concentration, ensure proper quenching, and check instrument calibration
- Poor Amplification Efficiency: Re-optimize primer concentrations, check for SNPs in binding sites, and verify template quality
- Inconsistent Replicates: Improve pipetting technique, ensure complete mixing of reactions, and check for evaporation
- Reference Gene Instability: Test additional reference genes and use geometric mean of multiple stable genes for normalization
Adherence to the MIQE (Minimum Information for Publication of Quantitative Real-Time PCR Experiments) guidelines ensures experimental rigor and reproducibility by providing a comprehensive framework for reporting qPCR experiments [25].
Core Principle of Absolute Quantification
Digital PCR (dPCR), including its droplet-based format (ddPCR), enables the absolute quantification of nucleic acid targets without the need for a standard curve. This method relies on sample partitioning, end-point PCR, and Poisson statistical analysis to count individual DNA molecules [26].
The fundamental process involves dividing a PCR reaction into thousands of nano-sized partitions, effectively creating individual microreactors. After amplification, each partition is analyzed for fluorescence. Partitions containing the target sequence (positive) are counted against those without it (negative). The ratio of positive to total partitions allows for calculation of the absolute target concentration in the original sample using Poisson distribution statistics [26].
Table 1: Key Differences between qPCR and dPCR/ddPCR
| Feature | Quantitative PCR (qPCR) | Digital/Droplet Digital PCR (dPCR/ddPCR) |
|---|---|---|
| Quantification Basis | Relative to standard curve | Absolute counting of molecules |
| Calibration Requirement | Requires external standards & calibration curve | No standard curve needed |
| Signal Measurement | Real-time during exponential phase | End-point detection |
| Data Output | Cycle threshold (Ct) value | Number of positive and negative partitions |
| Statistical Foundation | Comparative Ct quantification | Poisson distribution |
| Tolerance to Inhibitors | Moderate | High [26] |
| Sensitivity for Rare Mutations | Limited | High due to partitioning [26] |
The Partitioning Process and Statistical Foundation
Partitioning and Poisson Distribution
The partitioning step is critical for the absolute quantification of dPCR. The sample is randomly distributed across many partitions, with each partition containing zero, one, or a few target molecules [26]. This random distribution follows a Poisson distribution, which is described by the equation:
P(k) = (e^(-λ) * λ^k) / k!
Where:
- P(k) = Probability that a partition contains k target molecules
- λ = Average number of target molecules per partition (the concentration to be determined)
- k = Actual number of target molecules in a specific partition
- e = Base of the natural logarithm (~2.71828) [26]
The probability (p) that a partition contains at least one target molecule is the complement of the probability that it is empty: p = 1 - e^(-λ). After amplification and reading, the ratio of positive partitions (k/n) is used to calculate λ using the rearranged equation: λ = -ln(1 - k/n) [26].
Quantification Accuracy and Optimal Partition Loading
The accuracy of dPCR quantification is statistically defined and depends heavily on the number of partitions and their loading efficiency. Intuitively, confidence in estimating target concentration is lowest when most partitions are either empty or full [26].
The optimal precision for quantification is achieved at a λ value of approximately 1.6, which corresponds to about 20% of partitions being negative (empty). This loading provides the optimal balance for statistical confidence in the concentration calculation [26]. The precision of the estimation scales with the inverse square root of the number of partitions, making higher partition counts statistically advantageous [26].
Figure 1: dPCR/ddPCR Workflow - From sample partitioning to absolute quantification.
Experimental Protocol: dPCR/ddPCR for ctDNA Detection
Pre-Analytical Phase: Sample Collection and Preparation
- Blood Collection: Collect 3 × 9 mL of patient blood into Streck Cell Free DNA BCT vacuum tubes or similar cell-free DNA blood collection tubes to prevent cell lysis and preserve ctDNA [27].
- Plasma Separation: Centrifuge blood tubes within 2 hours of collection using a two-step centrifugation protocol (e.g., 1,600 × g for 10 minutes at 4°C, followed by 16,000 × g for 10 minutes at 4°C) to obtain platelet-poor plasma.
- cfDNA Extraction: Extract cell-free DNA (cfDNA) from plasma using commercially available kits (e.g., QIAamp Circulating Nucleic Acid Kit). Elute in a low-EDTA TE buffer or the kit's elution buffer. Quantify cfDNA using fluorometric methods suitable for low-concentration samples.
- Sample Storage: Store extracted cfDNA at -80°C if not used immediately. Avoid multiple freeze-thaw cycles.
dPCR/ddPCR Assay Setup and Execution
- Assay Design: Design specific primers and probes (FAM/HEX) for target mutations identified through prior tumor sequencing [27]. For rare mutation detection, ensure probe specificity is validated against wild-type sequences.
- Reaction Mixture: Prepare 20-40 μL reaction volumes containing:
- 2-9 μL of extracted cfDNA template
- 1× ddPCR Supermix
- 900 nM of each primer
- 250 nM of each probe
- Partitioning: Generate 20,000 droplets using a droplet generator according to manufacturer's instructions. For ddPCR, the oil:water emulsion creates ~20,000 nanodroplets per sample [27].
- PCR Amplification: Transfer droplets to a 96-well PCR plate, seal, and run on a thermal cycler with the following typical conditions:
- Enzyme activation: 95°C for 10 minutes
- 40-45 cycles of: Denaturation: 94°C for 30 seconds; Annealing/Extension: 55-60°C for 60 seconds
- Enzyme deactivation: 98°C for 10 minutes
- Hold at 4°C
- Signal Reading: Transfer the PCR plate to a droplet reader which counts each droplet individually for fluorescence detection in each channel.
Data Analysis and Interpretation
- Threshold Setting: Set fluorescence thresholds for positive/negative droplets clearly between populations using the manufacturer's software. Optimize to minimize "rain" (droplets with intermediate fluorescence) [28].
- Quality Control: Apply the dMIQE guidelines to ensure publication-quality data [28]. Report the number of accepted droplets, template concentration, and confidence intervals.
- Concentration Calculation: Use the Poisson-corrected fraction of positive droplets to calculate the absolute concentration of the target (copies/μL) in the original sample:
- Target Concentration = -ln(1 - p) × (Total Droplets / Volume Analyzed)
- Where p is the fraction of positive droplets
- Variant Allele Frequency (VAF): For mutant detection, calculate VAF as:
- VAF = (Mutant Concentration / (Mutant + Wild-type Concentration)) × 100
Figure 2: Statistical Principles of dPCR - Poisson distribution and key factors affecting quantification accuracy.
Application in ctDNA Research: Protocol and Data
Tumor-Informed ctDNA Detection Protocol
This protocol is adapted from the rectal cancer study comparing ddPCR and NGS for ctDNA detection [27]:
- Tumor Sequencing: First, perform NGS sequencing of tumor tissue (e.g., using Ion AmpliSeq Cancer Hotspot Panel v2) to identify patient-specific mutations [27].
- Assay Selection: Based on tumor sequencing results, select 1-2 mutations with the highest variant allele frequencies for ddPCR assay design [27].
- Custom Probe Design: Design specific ddPCR assays using custom TaqMan probes for the identified mutations.
- Baseline Plasma Testing: Test baseline plasma samples collected before therapy initiation using the customized ddPCR assays.
- Longitudinal Monitoring: Collect follow-up plasma samples at defined timepoints (e.g., post-surgery, during adjuvant therapy) and analyze with the same ddPCR assays.
- Result Interpretation: Classify samples as ctDNA-positive if any detectable ctDNA is present (even one oncogenic mutation), and ctDNA-negative if no ctDNA is detected [27].
Performance Comparison in ctDNA Detection
| Parameter | ddPCR | NGS Panel | Statistical Significance |
|---|---|---|---|
| Detection Rate (Development Group) | 24/41 (58.5%) | 15/41 (36.6%) | p = 0.00075 |
| Detection Rate (Validation Group) | 21/26 (80.8%) | Not reported | Not applicable |
| Association with Clinical Factors | Higher clinical tumor stage, lymph node positivity | Similar associations | Clinically relevant |
| Postoperative Detection | Limited detection before recurrences | Not reported | Needs optimization |
| Operational Costs | 5–8.5-fold lower than NGS [27] | Higher | Cost-effective |
Advantages for ctDNA Analysis
- High Sensitivity: ddPCR detects somatic alterations at low frequencies down to 0.01% variant allele frequency (VAF) [27], making it suitable for ctDNA detection where tumor DNA represents a small fraction of total cell-free DNA.
- Cost-Effectiveness: The operational costs of ctDNA detection with ddPCR are 5–8.5-fold lower than with NGS [27].
- Absolute Quantification: Provides direct measurement of mutant allele concentration without reference standards, enabling precise monitoring of treatment response.
- Tolerance to Inhibitors: Sample partitioning reduces the effect of PCR inhibitors present in clinical samples, improving reliability [26].
The Scientist's Toolkit: Essential Research Reagents and Materials
Table 3: Essential Materials for dPCR/ddPCR ctDNA Research
| Item | Function/Application | Examples/Specifications |
|---|---|---|
| Cell-Free DNA Blood Collection Tubes | Preserves blood sample integrity, prevents cell lysis during transport/storage | Streck Cell-Free DNA BCT tubes [27] |
| Nucleic Acid Extraction Kits | Isolation of high-quality cfDNA from plasma samples | QIAamp Circulating Nucleic Acid Kit |
| dPCR/ddPCR Supermix | Optimized reaction buffer for partitioning and amplification | ddPCR Supermix for Probes |
| Custom TaqMan Assays | Mutation-specific detection with fluorescent probes | Primer/probe sets for target mutations |
| Droplet Generation Oil | Creates stable water-in-oil emulsion for partitioning | Droplet Generation Oil for Probes |
| dPCR Plates and Sealers | Reaction containment during thermal cycling | 96-well dPCR plates, pierceable foil seals |
| Quantitative Reference Standards | Assay validation and quality control | Synthetic DNA standards with known mutations |
| Bioinformatic Analysis Software | Data analysis, threshold setting, concentration calculation | Manufacturer-specific analysis packages |
The detection and measurement of circulating tumor DNA (ctDNA) is a cornerstone of modern liquid biopsy applications, from monitoring treatment response to detecting minimal residual disease (MRD). The choice between quantitative PCR (qPCR) and digital PCR (dPCR) fundamentally shapes experimental design and data interpretation, revolving around a core methodological distinction: relative versus absolute quantification.
Relative quantification, employed by qPCR, measures target amount relative to a standard curve or control gene. In contrast, absolute quantification, achieved through dPCR, provides an exact count of target molecules without external calibration [29]. This technical distinction profoundly impacts assay sensitivity, precision, and utility in clinical cancer research, particularly for detecting rare ctDNA molecules against a background of wild-type DNA.
Core Principles: qPCR and dPCR Operational Mechanisms
Quantitative PCR (qPCR) and Relative Quantification
qPCR operates by monitoring PCR amplification in real-time, measuring the cycle threshold (Ct) at which fluorescence crosses a detection threshold. The Ct value is inversely proportional to the starting quantity of the target nucleic acid [29].
- Relative Quantification Framework: qPCR results are expressed relative to a standard curve constructed from samples with known concentrations, or normalized to an endogenous control gene. This provides a relative measure of change (e.g., fold-difference) rather than an absolute molecule count [29].
- Measurement Phase: Data collection occurs during the exponential amplification phase where the amount of PCR product approximately doubles each cycle, providing the most accurate correlation between Ct and starting quantity [29].
Digital PCR (dPCR) and Absolute Quantification
dPCR takes a fundamentally different approach by partitioning a sample into thousands of individual reactions. After endpoint amplification, the ratio of positive to negative partitions is counted [30].
- Absolute Quantification Framework: Using Poisson statistics, this ratio directly calculates the absolute number of target molecules in the original sample without requiring a standard curve [29] [30].
- Partitioning Technology: Current commercial platforms achieve partitioning via microchips (e.g., QuantStudio 12K Flex, BioMark HD) or water-in-oil droplets (e.g., QX200 from Bio-Rad) [30].
The table below summarizes the key technical distinctions between these approaches:
Table 1: Fundamental Operational Differences Between qPCR and dPCR
| Parameter | Quantitative PCR (qPCR) | Digital PCR (dPCR) |
|---|---|---|
| Quantification Type | Relative | Absolute |
| Calibration Requirement | Requires standard curve | No standard curve needed |
| Measurement Principle | Cycle threshold (Ct) during exponential phase | Positive/Negative partition count at endpoint |
| Data Output | Relative quantity or fold-change | Exact copy number per input volume |
| Impact of Amplification Efficiency | Highly sensitive to efficiency variations | Less affected by efficiency variations |
| Ideal Application Scope | Gene expression, pathogen load with abundant targets | Rare allele detection, liquid biopsy, viral load at low concentrations |
Visualizing the Workflow Divergence
The following diagram illustrates the fundamental procedural differences between the two quantification methodologies:
Performance Comparison in ctDNA Analysis
Sensitivity and Precision for Low Abundance Targets
ctDNA analysis presents a singular challenge: detecting extremely rare mutant alleles within a vast background of wild-type cell-free DNA. In this context, dPCR's absolute quantification provides decisive advantages:
- Superior Sensitivity for Rare Alleles: dPCR's partitioning effectively enriches low-frequency targets, enabling detection of variants at variant allele frequencies (VAF) as low as 0.01% under optimal conditions [27] [31]. This is crucial for MRD detection where ctDNA levels can be minuscule.
- Enhanced Precision at Low Concentrations: dPCR demonstrates significantly improved precision for quantifying low-copy number targets, a critical factor for reliable ctDNA monitoring [30]. This precision is maintained even with suboptimal amplification efficiency, whereas qPCR quantification accuracy depends heavily on high, consistent efficiency [30].
- Direct Comparison Evidence: A 2025 performance comparison in rectal cancer patients demonstrated that ddPCR detected ctDNA in 58.5% (24/41) of baseline plasma samples, significantly outperforming an NGS panel which detected ctDNA in only 36.6% (15/41) of the same samples (p=0.00075) [27].
Tolerance to Sample Inhibitors and PCR Efficiency
Complex biological samples like plasma often contain substances that can inhibit PCR amplification, potentially compromising results:
- Robustness Against Inhibitors: dPCR has demonstrated greater tolerance to PCR inhibitors present in clinical samples because endpoint detection is less affected than the reaction kinetics measured in qPCR [30].
- Efficiency Independence: qPCR quantification assumes near-perfect amplification efficiency (接近 100%), which is not always achievable. dPCR, relying on binary endpoint detection, provides accurate absolute quantification even with reduced amplification efficiency [30].
Table 2: Analytical Performance Comparison for ctDNA Detection
| Performance Characteristic | qPCR | dPCR | Implication for ctDNA Research |
|---|---|---|---|
| Limit of Detection (VAF) | ~1-5% | ~0.01%-0.1% | dPCR enables MRD and early-stage cancer detection |
| Precision (Low Target) | Moderate | High | More reliable tracking of molecular response |
| Impact of Inhibitors | Significant | Reduced | More robust with difficult sample matrices |
| Dependence on Amplification Efficiency | Critical | Minimal | More accurate quantification with suboptimal reactions |
| Multiplexing Capability | High (4-6 colors) | Limited (typically 2 colors) | qPCR advantageous for multi-gate panels |
| Dynamic Range | Wide (6-8 logs) | Moderate (due to partition count) | qPCR better for quantifying high-concentration targets |
Experimental Protocols for ctDNA Quantification
Protocol: Tumor-Informed ctDNA Detection via ddPCR
This protocol outlines a tumor-informed approach where mutations identified in tumor tissue are tracked in plasma using mutation-specific ddPCR assays [27] [32].
Table 3: Essential Research Reagent Solutions
| Reagent/Kit | Function | Application Note |
|---|---|---|
| Streck Cell-Free DNA BCT Tubes | Blood collection for plasma stabilization | Preserves cfDNA by inhibiting nuclease activity and cell lysis [27] |
| QIAamp Circulating Nucleic Acid Kit | cfDNA extraction from plasma | High-sensitivity recovery of short-fragment cfDNA [33] |
| ddPCR Supermix for Probes (Bio-Rad) | PCR reaction mixture for droplet generation | Optimized for water-in-oil droplet formation and stability |
| Mutation-Specific TaqMan Assays | Target-specific probe and primer sets | Custom-designed for patient-specific mutations; FAM/HEX labeled |
| Droplet Generation Oil | Creation of water-in-oil emulsion | Critical for partition formation in QX200 systems |
| dgDNA/UDG Enzyme Treatment | Prevention of carryover contamination | Degrades contaminating amplicons from previous PCR runs |
Step-by-Step Procedure:
- Sample Collection and Processing: Collect patient blood in Streck Cell-Free DNA BCT tubes (e.g., 3 × 9 mL tubes) [27]. Centrifuge within 96 hours to isolate plasma. Perform a second high-speed centrifugation (e.g., 12,000 × g for 10 min) to remove residual cells [33].
- cfDNA Extraction: Extract cfDNA from 2-4 mL of plasma using the QIAamp Circulating Nucleic Acid Kit or equivalent. Elute in a low volume (e.g., 30-50 µL) of TE buffer or nuclease-free water. Quantify using a fluorescence-based assay (e.g., Qubit dsDNA HS Assay) [33].
- Assay Design: For tumor-informed detection, identify somatic mutations (e.g., SNVs, Indels) from primary tumor sequencing (e.g., using an Ion AmpliSeq Cancer Hotspot Panel v2) [27]. Design and validate custom TaqMan ddPCR assays for 1-2 mutations with the highest variant allele frequency in the tumor.
- ddPCR Reaction Setup: Prepare a 20-22 µL reaction mixture containing:
- 10-20 ng of extracted cfDNA (or equivalent volume if low yield)
- 1× ddPCR Supermix for Probes
- 900 nM of each primer
- 250 nM of each FAM/HEX-labeled probe
- Droplet Generation: Load the reaction mixture into a DG8 Cartridge of a QX200 Droplet Generator along with Droplet Generation Oil. This creates approximately 20,000 nanodroplets per sample [27].
- PCR Amplification: Transfer the generated droplets to a 96-well plate. Seal the plate and perform PCR amplification on a thermal cycler using optimized cycling conditions (e.g., 95°C for 10 min, 40 cycles of 94°C for 30 sec and 55-60°C for 60 sec, 98°C for 10 min, 4°C hold).
- Droplet Reading and Analysis: Read the plate on a QX200 Droplet Reader. Analyze the data using QuantaSoft software. Set thresholds to distinguish positive and negative droplets for each channel. The software uses Poisson statistics to calculate the absolute concentration (copies/µL) of the target mutation in the original reaction [29].
- Result Interpretation: A sample is deemed ctDNA-positive if any detectable target mutation is present above a pre-defined threshold (e.g., ≥ 2 positive droplets for the mutant allele) [27]. Report mutant copies per mL of plasma for clinical correlation.
Protocol: Tumor-Agnostic ctDNA Detection via qPCR-based NGS Panel
This protocol uses a tumor-agnostic NGS panel with qPCR-based library quantification, suitable for detecting a defined set of mutations without prior tumor sequencing [33].
Step-by-Step Procedure:
- Sample Collection and cfDNA Extraction: Follow identical steps as in the ddPCR protocol (Steps 1-2) to obtain purified cfDNA.
- Library Preparation: Use a targeted NGS panel (e.g., Oncomine Breast cfDNA Assay covering 150 hotspots in 10 genes) with 10-20 ng input cfDNA [33]. Prepare sequencing libraries per manufacturer's instructions, incorporating barcodes for sample multiplexing.
- Library Quantification via qPCR: Quantify the final library concentration using a qPCR-based method (e.g., Kapa Library Quantification Kit). This step is critical for determining optimal loading concentration for sequencing and inherently relies on relative quantification against a DNA standard curve.
- Next-Generation Sequencing: Pool libraries and sequence on an appropriate platform (e.g., Ion GeneStudio S5 or Illumina MiSeq/NextSeq) to achieve high sequencing depth (e.g., median >20,000× coverage) [33].
- Bioinformatic Analysis and Variant Calling: Align sequences to the reference genome. Call variants using the panel's specific bioinformatics pipeline. A variant is typically called positive if its VAF is above the assay's limit of detection (LOD), which must be empirically determined for each variant type [34].
Application Contexts: Guiding Method Selection
The choice between qPCR and dPCR is dictated by the specific research question and context:
- Minimal Residual Disease (MRD) and Early Recurrence: dPCR is the preferred method due to its superior sensitivity for detecting very low VAF ctDNA (<0.1%) [31]. In melanoma, baseline ctDNA detection by ddPCR was a powerful prognostic biomarker, identifying patients with high recurrence risk [32].
- Treatment Response Monitoring: Both technologies can track dynamic changes. dPCR offers superior precision for small fold-changes, while qPCR-NGS panels can monitor multiple mutations simultaneously, providing a broader view of clonal evolution [31].
- Genotyping in Advanced Disease: For characterizing known actionable mutations at higher VAF, qPCR-based NGS panels offer a cost-effective solution for screening multiple genomic regions simultaneously [34].
The distinction between relative (qPCR) and absolute (dPCR) quantification is more than technical—it defines the boundaries of possible research and clinical applications in ctDNA analysis. dPCR provides the sensitivity, precision, and absolute quantification necessary for the most challenging applications like MRD detection and early intervention studies. Conversely, qPCR and its NGS derivatives offer a broader, more efficient screening platform for genotyping and monitoring higher VAF targets. The informed researcher must align their quantification choice with their biological question, leveraging the strengths of each platform to advance the paradigm of liquid biopsy in oncology.
Methodology in Action: Implementing dPCR and qPCR for ctDNA Analysis
The analysis of circulating tumor DNA (ctDNA) has emerged as a powerful, minimally invasive tool in oncology, enabling applications from early cancer detection to therapeutic monitoring [35]. ctDNA consists of short, fragmented DNA molecules shed by tumors into the bloodstream, which typically represent only a small fraction (0.1% to over 10%) of the total cell-free DNA (cfDNA) in cancer patients [36] [35]. Detecting these rare mutations requires highly sensitive and robust molecular techniques. This application note provides a detailed comparison of two primary technologies used for ctDNA analysis: Quantitative Real-Time PCR (qPCR) and Digital PCR (dPCR), framing their workflows from initial sample collection through final data analysis. The focus is placed on their application within clinical research settings for drug development and cancer management.
Digital PCR (dPCR) works by partitioning a PCR reaction into thousands of individual nanoreactions. After endpoint amplification, each partition is analyzed as positive or negative for the target, allowing for absolute quantification of the target molecule without the need for a standard curve [37] [5]. This partitioning enhances sensitivity and resistance to PCR inhibitors, making dPCR particularly suited for detecting rare mutations and targets present at low concentrations [36] [5].
Quantitative Real-Time PCR (qPCR) monitors the amplification of a target DNA sequence in real-time using fluorescent reporters. The cycle threshold (Cq) at which fluorescence crosses a defined level is used for relative quantification, typically with the aid of a standard curve [37] [5]. While qPCR is a versatile and high-throughput method, its sensitivity for detecting very rare mutant alleles in a high background of wild-type DNA can be limited [38] [5].
The table below summarizes the key characteristics of both platforms in the context of ctDNA analysis:
Table 1: Performance Comparison of dPCR and qPCR for ctDNA Detection
| Feature | Digital PCR (dPCR) | Quantitative Real-Time PCR (qPCR) |
|---|---|---|
| Principle of Quantification | Absolute, by direct counting of molecules [5] | Relative, requires a standard curve [5] |
| Sensitivity for Rare Mutations | High; can detect mutant allele frequencies as low as 0.1% [36] | Lower; sensitive to background noise from wild-type DNA [38] |
| Dynamic Range | Narrower [5] | Wide (6-7 orders of magnitude) [5] |
| Throughput | Lower [5] | High (compatible with 384-well plates) [5] |
| Cost per Reaction | Higher [5] | Lower [5] |
| Robustness to PCR Inhibitors | High (partitioning dilutes inhibitors) [5] | Sensitive [5] |
| Ideal Application in ctDNA Research | Rare mutation detection, low-abundance target quantification, liquid biopsy [36] [35] | High-throughput screening, gene expression, pathogen detection [5] |
Experimental Protocols
Pre-Analytical Sample Processing
The pre-analytical phase is critical for obtaining high-quality, reliable ctDNA data, as cfDNA is present in low concentrations and can be easily contaminated or degraded.
- Sample Collection: Blood should be collected in tubes containing stabilizers that prevent the lysis of white blood cells and preserve the cfDNA profile, such as cell-free DNA BCT tubes or ACD tubes [39]. The sample should be inverted gently several times to ensure proper mixing with the preservative.
- Plasma Separation: Plasma must be separated within a strict timeframe to ensure sample integrity, typically within 1 to 4 hours of collection if using standard EDTA tubes, or up to several days if using specialized cfDNA BCT tubes [39]. A two-step centrifugation protocol is recommended:
- First Spin: A low-speed centrifugation (e.g., 800-1,600 × g for 10-20 minutes at room temperature) to separate plasma from whole blood cells.
- Second Spin: The transferred plasma is subjected to a high-speed centrifugation (e.g., 16,000 × g for 10 minutes at 4°C) to remove any remaining cellular debris and platelets [39].
- cfDNA Extraction: The clarified plasma is then used for cfDNA extraction. Magnetic bead-based methods are widely adopted due to their high recovery rates, automation compatibility, and ability to produce high-quality cfDNA with a characteristic mononucleosomal size peak of ~167 base pairs [39]. The extraction should be performed according to the manufacturer's protocol, and the final eluate should be stored at -20°C or -80°C until analysis.
- Quality Control (QC): Extracted cfDNA should be quantified and assessed for quality. Fluorometric methods (e.g., Qubit) are preferred over spectrophotometry for accurate concentration measurement. Fragment analyzers (e.g., Agilent TapeStation) can confirm the size distribution of cfDNA and check for contamination with high molecular weight genomic DNA, which can interfere with downstream assays [39] [40].
Protocol A: Detection of KRAS Mutations via PNB-qPCR
This protocol, derived from a published study, describes a highly sensitive nested qPCR approach with wild-type blocking to detect low-frequency KRAS mutations [38].
- Step 1: First-Round PCR with WT Blocking
- Objective: To selectively enrich mutant KRAS alleles from a background of wild-type DNA.
- Reaction Setup: Prepare a PCR mix containing the extracted cfDNA template, primers specific for the KRAS exon 2 region, and wild-type (WT) specific blocking primers. These blocking primers, which can be peptide nucleic acid (PNA) or locked nucleic acid (LNA) clamps, hybridize preferentially to the wild-type sequence and suppress its amplification during the PCR, thereby enriching the mutant targets [38].
- Thermal Cycling: Perform a standard PCR amplification protocol.
- Step 2: Product Pooling
- To reduce variance and improve quantification accuracy, the protocol recommends setting up five separate first-round PCR reactions for each sample. After amplification, the products of these five reactions are pooled together [38].
- Step 3: Second-Round Quantitative PCR
- Objective: To specifically detect and quantify the enriched mutant alleles.
- Reaction Setup: Use the pooled first-round product as a template for a qPCR reaction. The qPCR employs mutation-specific ARMS (Amplification Refractory Mutation System) primers and short LNA probes to ensure high specificity for the seven most frequent KRAS point mutations in exon 2 [38].
- Data Analysis: The cycle of quantification (Cq) is determined. A standard curve, generated using synthetic DNA standards with known mutations, is used for absolute quantification. The PNB-qPCR method has demonstrated a limit of quantification (LOQ) as low as 6.25 copies and can detect a mutant allele frequency of 0.003% (1 mutant in 30,000 WT copies) [38].
Protocol B: Absolute Quantification of ctDNA using Digital PCR
This protocol outlines a standard dPCR workflow for the absolute quantification of known somatic mutations in ctDNA, such as those in the PIK3CA or ESR1 genes in breast cancer [36] [35].
- Step 1: Assay Preparation
- Assay Selection: For known mutations, use pre-validated, sequence-specific assays, such as TaqMan probe-based assays [36]. These are available as pre-formulated kits (e.g., Absolute Q Liquid Biopsy dPCR assays) or can be custom-designed.
- Reaction Setup: Prepare a dPCR reaction mix containing the master mix, fluorescently labeled probes (e.g., FAM for mutant, VIC for wild-type), and the extracted cfDNA sample.
- Step 2: Partitioning
- Step 3: Endpoint PCR Amplification
- The partitioned plate or cartridge is placed in a thermal cycler and run through a standard PCR protocol to endpoint amplification.
- Step 4: Data Acquisition and Analysis
- Reading: The dPCR instrument scans each partition for fluorescence signals.
- Analysis: Software is used to count the positive and negative partitions for each fluorescent channel. The concentration of the target mutant and wild-type DNA in the original sample (in copies/µL) is calculated using Poisson statistics. The variant allele frequency (VAF) is then determined as (mutant concentration / total DNA concentration) × 100%. Platforms like the QuantStudio Absolute Q system can detect VAFs as low as 0.1% [36].
Workflow Visualization
The following diagram illustrates the core procedural differences between the qPCR and dPCR workflows for ctDNA analysis.
The Scientist's Toolkit
The table below lists key reagents and materials essential for conducting ctDNA analysis, as referenced in the protocols above.
Table 2: Essential Research Reagents and Materials for ctDNA Analysis
| Item | Function / Application | Examples / Specifications |
|---|---|---|
| cfDNA Blood Collection Tubes | Stabilizes nucleated blood cells to prevent genomic DNA contamination and preserve cfDNA profile for longer periods before processing. | Cell-free DNA BCT tubes (e.g., from Streck) [39] |
| Magnetic Bead-based cfDNA Kits | High-efficiency extraction of short, low-concentration cfDNA fragments from plasma; automatable. | Kits from various manufacturers (e.g., nRichDx, QIAamp) [39] |
| dPCR Master Mix & Assays | Optimized reagents and pre-designed probes for sensitive and specific mutation detection on dPCR platforms. | Absolute Q Liquid Biopsy dPCR Assays, TaqMan dPCR Master Mix [36] |
| Reference Standards | Controls for assay validation, determining recovery rates, limit of detection, and quantification accuracy. | Seraseq ctDNA, AcroMetrix ctDNA plasma controls [39] |
| Fragment Analyzer | Quality control instrument to assess cfDNA size profile and check for high molecular weight gDNA contamination. | Agilent TapeStation system [39] |
| LNA/PNA Clamping Oligos | Synthetic nucleic acids used in qPCR to suppress wild-type DNA amplification, enriching for mutant sequences. | Used in PNB-qPCR and similar methods [38] |
Circulating tumor DNA (ctDNA) consists of small fragments of DNA released by tumor cells into the bloodstream and other bodily fluids. As a minimally invasive real-time biomarker, ctDNA reflects overall tumor burden and molecular heterogeneity, offering significant advantages over traditional tissue biopsies [41]. The short half-life of ctDNA (estimated between 16 minutes to several hours) enables dynamic monitoring of treatment response and disease progression, enabling near real-time assessment of tumor dynamics [1]. These characteristics make ctDNA particularly valuable for two critical applications in oncology: monitoring treatment response and detecting minimal residual disease (MRD) – the presence of microscopic disease after curative-intent therapy that precedes clinical recurrence [42] [1].
The detection and analysis of ctDNA require highly sensitive molecular techniques due to its typically low concentration in circulation, especially in early-stage cancers and MRD settings where tumor DNA may constitute less than 0.1% of total cell-free DNA [42] [1]. This technical note examines the application of ctDNA analysis in treatment monitoring and MRD detection, with particular emphasis on the comparative performance of digital PCR (dPCR) and quantitative PCR (qPCR) methodologies.
Comparative Performance of Detection Technologies
Analytical Sensitivity and Clinical Applications
The selection of appropriate detection methodology is crucial for reliable ctDNA analysis. dPCR partitions samples into thousands of individual reactions, allowing absolute quantification without standard curves and enabling detection of rare mutations with variant allele frequencies as low as 0.1% or less [43] [24]. In contrast, qPCR demonstrates a higher limit of detection of approximately 1% mutant allele frequency and requires standard curves for relative quantification [43]. This difference in sensitivity is particularly relevant for MRD detection, where tumor DNA fractions are typically minute following curative-intent therapy.
A 2024 meta-analysis assessing ctDNA detection across multiple cancer types demonstrated significant differences in sensitivity between platforms, with next-generation sequencing (NGS) showing the highest sensitivity at 94%, followed by dPCR at 81%, and qPCR at 51% [44]. The same analysis found that specificity was consistently high across all platforms, confirming the reliability of positive results [44].
Table 1: Comparative Performance of ctDNA Detection Technologies
| Technology | Sensitivity | Specificity | Limit of Detection | Quantification Method | Best Applications |
|---|---|---|---|---|---|
| qPCR | 51% (pooled analysis) | Similar across platforms | ~1% VAF | Relative (requires standard curve) | Treatment monitoring in advanced disease |
| dPCR | 81% (pooled analysis) | Similar across platforms | ≥0.1% VAF | Absolute (Poisson statistics) | MRD detection, low-abundance targets |
| NGS | 94% (pooled analysis) | Similar across platforms | 0.01%-0.001% VAF | Relative (based on sequencing depth) | Comprehensive mutation profiling |
Technical Considerations for Platform Selection
Beyond sensitivity, several technical factors influence platform selection for ctDNA applications. dPCR demonstrates higher tolerance to PCR inhibitors and is less affected by amplification efficiency variations due to its endpoint detection nature [43]. This increased robustness makes dPCR particularly suitable for analyzing challenging sample types. Additionally, dPCR provides higher precision and reproducibility across laboratories, valuable attributes for longitudinal monitoring studies [43] [24].
qPCR maintains advantages in throughput, established protocols, and broader dynamic range for higher concentration analytes [43]. For applications requiring detection of multiple unknown mutations or comprehensive genomic profiling, NGS-based approaches offer clear advantages despite typically longer turnaround times and higher costs [1] [41].
Platform Selection Decision Tree: This workflow guides technology selection based on application requirements, sample characteristics, and mutation information availability.
ctDNA for Treatment Response Monitoring
Dynamic Assessment of Therapy Effectiveness
The use of ctDNA for treatment response monitoring capitalizes on its short half-life and correlation with tumor burden [1]. Unlike imaging modalities that assess anatomical changes, ctDNA provides molecular insights into treatment effectiveness, often detecting response or resistance weeks before radiographic evidence [45] [1]. In recurrent/metastatic head and neck squamous cell carcinoma (R/M HNSCC), longitudinal ctDNA monitoring using a highly sensitive NGS assay demonstrated that ctDNA negativity during treatment was significantly associated with improved disease control, three-year overall survival, and progression-free survival [45].
The quantitative nature of ctDNA analysis enables precise assessment of molecular response through metrics such as ctDNA clearance rate and percent change from baseline levels [1]. In solid tumors treated with immune checkpoint blockade, early ctDNA changes after just one treatment cycle have shown strong prognostic value across multiple cancer types, including HNSCC, non-small cell lung cancer, colorectal cancer, and urothelial carcinoma [45].
Protocol: Longitudinal Treatment Monitoring Using dPCR
Table 2: Experimental Protocol for Treatment Monitoring Using dPCR
| Step | Procedure | Technical Notes | Quality Control |
|---|---|---|---|
| 1. Baseline Sampling | Collect 10-20 mL blood in cell-free DNA BCT tubes before treatment initiation | Process within 6 hours for optimal yield | Record time from collection to processing |
| 2. Plasma Processing | Double centrifugation: 1,600×g for 10 min, then 16,000×g for 10 min | Use chilled centrifuge (4°C) | Aliquot plasma to avoid freeze-thaw cycles |
| 3. cfDNA Extraction | Use silica membrane-based cfDNA extraction kits | Elute in low-EDTA TE buffer or molecular grade water | Quantify using fluorometry; expect 5-50 ng/μL |
| 4. Assay Design | Design primers/probes for tumor-specific mutations | Optimal amplicon size: 60-100 bp | Test specificity with wild-type controls |
| 5. dPCR Setup | Prepare reaction mix with 5-20 ng cfDNA per reaction | Include no-template and wild-type controls | Partition into 10,000-20,000 droplets/well |
| 6. Thermal Cycling | Standard cycling: 95°C for 10 min, 40 cycles of 94°C for 30s and 55-60°C for 60s | Optimize annealing temperature for each assay | Include fluorescence measurement step |
| 7. Data Analysis | Calculate mutant copies/μL using Poisson statistics | Set threshold based on negative controls | Report variant allele frequency (VAF) |
| 8. Longitudinal Sampling | Repeat sampling at defined intervals (e.g., every 2 cycles) | Maintain consistent processing protocols | Normalize to input cfDNA concentration |
For treatment monitoring applications, blood-based plasma is the most common liquid biopsy source due to its systemic circulation and accessibility [8]. The procedural ease enables repeated sampling throughout treatment, providing a dynamic assessment of disease status and enabling timely therapeutic adjustments [1] [41].
ctDNA for Minimal Residual Disease Detection
Predicting Clinical Relapse
MRD detection represents one of the most challenging applications for ctDNA analysis due to the exceptionally low tumor DNA concentrations following curative-intent therapy. The ability to detect molecular relapse months before clinical or radiographic recurrence has been demonstrated across multiple cancer types, with studies showing lead times of 2-9 months [42] [24]. This early detection window creates opportunities for therapeutic intervention when disease burden is lowest.
In a study of breast cancer patients, longitudinal monitoring of ctDNA using dPCR demonstrated the ability to detect emerging ESR1 mutations during endocrine therapy, with residual ctDNA after curative treatment predicting early relapse [24]. Similarly, in colorectal cancer, the presence of post-operative ctDNA was strongly associated with recurrence risk, while its absence indicated prolonged disease-free survival [42] [1].
Protocol: MRD Detection Using Tumor-Informed dPCR
Table 3: Tumor-Informed dPCR Protocol for MRD Detection
| Step | Procedure | Key Considerations | Troubleshooting |
|---|---|---|---|
| 1. Tumor Tissue Analysis | Perform NGS on FFPE tumor tissue to identify somatic mutations | Select 2-5 high-clonality mutations | Include variants with high allele frequency in tumor |
| 2. Assay Development | Design dPCR assays for patient-specific mutations | Prioritize variants in genomic regions with good coverage | Verify assay performance with synthetic controls |
| 3. Pre-operative Blood | Collect plasma before surgical resection | Use as positive control for mutation detection | Sufficient volume for assay optimization (≥10 mL) |
| 4. Post-operative Sampling | Collect serial post-treatment samples (e.g., 1, 3, 6 months) | Consistent timing relative to treatment | Process immediately or store at -80°C |
| 5. Ultra-sensitive dPCR | Optimize reaction conditions for low VAF detection | Increase input DNA (up to 50 ng/reaction) | Use maximum number of partitions available |
| 6. Data Interpretation | Apply statistical thresholds for positivity | Poisson confidence intervals for low copies | Multiple mutations increase detection confidence |
| 7. Result Reporting | Report copies/mL and mutant allele frequency | Include limit of detection for each assay | Longitudinal trend analysis is critical |
The tumor-informed approach detailed in this protocol significantly enhances MRD detection sensitivity by focusing on mutations unequivocally present in the patient's tumor [45]. This method typically achieves 10-100 fold higher sensitivity compared to tumor-agnostic approaches that target common mutations alone [45].
MRD Detection Workflow: Tumor-informed approach for minimal residual disease detection using serial plasma sampling after curative-intent therapy.
The Scientist's Toolkit: Essential Research Reagents
Table 4: Essential Research Reagents for ctDNA Analysis
| Reagent Category | Specific Products | Function | Application Notes |
|---|---|---|---|
| Blood Collection Tubes | Cell-free DNA BCT tubes (Streck), PAXgene Blood cDNA tubes | Stabilize nucleated cells to prevent background DNA release | Critical for reproducible results; maintain sample integrity during transport |
| cfDNA Extraction Kits | QIAamp Circulating Nucleic Acid Kit, MagMAX Cell-Free DNA Isolation Kit | Isolve and purify cfDNA from plasma | High recovery efficiency essential for low-abundance targets |
| dPCR Master Mixes | ddPCR Supermix, QIAcuity Probe PCR Kit | Provide optimized reaction components | Partitioning stability crucial for reproducible quantification |
| Assay Design Software | Primer3, dPCR assay design tools | Design target-specific primers and probes | Optimal amplicon size: 60-100 bp for fragmented cfDNA |
| Reference Materials | Horizon Multiplex I, gDNA standards | Assay validation and quality control | Essential for establishing limits of detection and quantification |
| Partitioning Reagents | Droplet Generation Oil, Nanoplates | Create individual reaction compartments | Quality affects partition integrity and data reliability |
| Mutation Controls | Synthetic mutant and wild-type sequences | Verify assay specificity and sensitivity | Particularly important for tumor-informed approaches |
ctDNA analysis has transformed capabilities for treatment monitoring and MRD detection in oncology research. The selection between dPCR and qPCR platforms depends on specific application requirements, with dPCR offering superior sensitivity for low-abundance targets in MRD settings, while qPCR remains valuable for monitoring higher tumor burden situations. The tumor-informed approach significantly enhances detection sensitivity for MRD applications by focusing on patient-specific mutations. As technologies continue to evolve, standardization of pre-analytical procedures and analytical reporting will be crucial for translating these research applications into routine clinical practice.
Circulating tumor DNA (ctDNA) has emerged as a pivotal biomarker in oncology, offering a minimally invasive method for cancer detection and monitoring. In non-metastatic rectal cancer, the detection of ctDNA holds significant promise for identifying patients who may benefit from neoadjuvant or adjuvant therapy, thus personalizing treatment approaches [46] [1]. This case study focuses on the comparative analysis of two primary ctDNA detection technologies—Droplet Digital PCR (dPCR) and Next-Generation Sequencing (NGS)—within the context of a broader research thesis comparing Digital PCR to quantitative PCR (qPCR). The analytical performance, workflow efficiency, and clinical utility of these methods are evaluated in the management of localized rectal cancer [23] [27].
ctDNA consists of short, tumor-derived DNA fragments released into the bloodstream through apoptosis, necrosis, or active secretion from tumor cells [46] [47]. In patients with cancer, ctDNA typically constitutes less than 1-10% of the total cell-free DNA (cfDNA), presenting a considerable technical challenge for detection, especially in early-stage or non-metastatic diseases [27] [1]. The short half-life of ctDNA, ranging from 16 minutes to 2.5 hours, enables real-time monitoring of tumor dynamics and treatment response [47] [1].
Results
Detection Performance in Non-Metastatic Rectal Cancer
In a 2025 comparative study involving a development cohort of 41 patients with non-metastatic rectal cancer, significant differences in detection sensitivity were observed between dPCR and a targeted NGS panel when analyzing baseline plasma samples collected before any therapy [23] [27].
Table 1: ctDNA Detection Rates in Non-Metastatic Rectal Cancer (Development Cohort, n=41)
| Detection Method | Patients with Detectable ctDNA | Detection Rate | P-value |
|---|---|---|---|
| ddPCR | 24/41 | 58.5% | 0.00075 |
| NGS Panel | 15/41 | 36.6% |
This superior detection sensitivity of dPCR was further validated in an independent cohort, where 80.8% (21/26) of patients showed detectable ctDNA in pre-therapy plasma [27]. The study also established a significant association between positive ctDNA status and higher clinical tumor stage, as well as lymph node positivity identified by MRI, indicating that ctDNA levels correlate with tumor burden in localized rectal cancer [23] [27].
Prognostic Value and Recurrence Prediction
The presence of ctDNA post-treatment has demonstrated strong prognostic value across multiple cancer types, including rectal cancer. A 2025 meta-analysis encompassing 22 studies and 1,519 patients with esophageal cancer revealed that ctDNA detection at various treatment timepoints consistently correlated with poorer survival outcomes [48].
Table 2: Prognostic Value of ctDNA at Different Treatment Timepoints (Meta-Analysis)
| Treatment Timepoint | Hazard Ratio for PFS | Hazard Ratio for OS |
|---|---|---|
| Baseline | 1.90 | 2.39 |
| Post-Neoadjuvant Therapy | 4.07 | 3.15 |
| During Follow-up | 5.22 | 5.37 |
This meta-analysis demonstrated that the prognostic significance of ctDNA increases throughout the treatment course, with the highest hazard ratios observed during follow-up monitoring [48]. Similarly, in colorectal cancer liver metastases, postoperative ctDNA detection was associated with significantly shorter disease-free survival (9 months vs. 13 months) and served as an independent predictor of recurrence [49].
Technical Performance and Methodological Considerations
A 2025 technology evaluation study compared a novel NGS-based Bridge Capture technology against dPCR for mutation profiling in metastatic colorectal cancer patients, demonstrating a very strong correlation in variant allele frequency (VAF) values across 80 plasma samples (Spearman correlation coefficient rs = 0.86) [50]. The concordance between the two methods was substantial (kappa = 0.70), though disagreements primarily occurred at very low VAF values (median 0.03%) [50].
The study also highlighted that dPCR offers operational costs 5-8.5-fold lower than NGS, making it more accessible for repeated monitoring in clinical settings [27]. However, NGS provides the advantage of detecting multiple mutations simultaneously without requiring prior knowledge of the tumor mutation profile, which is particularly valuable for identifying heterogeneous mutations and resistance mechanisms [50].
Discussion
Clinical Implications for Non-Metastatic Rectal Cancer
The findings from this case study demonstrate that dPCR exhibits superior sensitivity for ctDNA detection in non-metastatic rectal cancer compared to targeted NGS panels, making it particularly suitable for minimal residual disease (MRD) detection and recurrence risk assessment [23] [27]. The association between pre-therapy ctDNA levels and established risk factors like advanced tumor stage and lymph node involvement suggests that ctDNA analysis could enhance traditional staging methods and help identify patients who might benefit from treatment intensification [27].
The strong prognostic value of ctDNA at post-treatment timepoints, especially after neoadjuvant therapy and during surveillance, underscores its potential as a dynamic biomarker for guiding adjuvant therapy decisions in rectal cancer [48]. The ability of ctDNA to predict recurrence several months before radiographic detection (with an average lead time of 4.53 months in esophageal cancer) provides a critical window for early intervention [48].
Method Selection: dPCR versus NGS
The choice between dPCR and NGS for ctDNA analysis in rectal cancer depends on specific clinical and research objectives. dPCR offers advantages of superior sensitivity for low-frequency mutations, absolute quantification without standard curves, faster turnaround times, and lower operational costs [46] [27]. These characteristics make it ideal for monitoring known mutations in tumor-informed approaches and for applications requiring high sensitivity, such as MRD detection [27] [49].
Conversely, NGS provides a more comprehensive mutational profiling capability, enabling the detection of novel and resistance mutations without prior knowledge of the tumor genome [1] [50]. The development of advanced NGS technologies like Bridge Capture has improved the accuracy of detecting low-frequency variants, narrowing the sensitivity gap with dPCR [50]. NGS is particularly valuable for initial tumor profiling, identifying heterogeneous mutations, and detecting emerging resistance mechanisms during targeted therapy [50].
Integration with Broader Research on dPCR vs qPCR
Within the context of a broader thesis comparing dPCR to qPCR for ctDNA detection, this case study highlights the transformative sensitivity advantage of digital PCR platforms over conventional PCR-based methods. While qPCR typically detects mutant allele frequencies (MAFs) above 10%, dPCR can reliably detect MAFs as low as 0.001%, representing a sensitivity improvement of several orders of magnitude [46]. This enhanced sensitivity is crucial for ctDNA applications in non-metastatic cancers where tumor DNA constitutes a minute fraction of total cfDNA.
The partitioning technology employed in dPCR, which divides reactions into thousands of individual droplets or chambers, enables absolute quantification of target molecules without reference standards and provides greater tolerance to PCR inhibitors compared to qPCR [46]. These technical advantages position dPCR as the preferred PCR-based method for ctDNA analysis, particularly in scenarios requiring utmost sensitivity for low-abundance targets.
Experimental Protocols
Sample Collection and Pre-analytical Processing
Blood Collection and Plasma Separation:
- Collect 20-30 mL of peripheral blood into Streck Cell-Free DNA BCT tubes or equivalent cell-stabilization tubes [27] [47].
- Process samples within 2-6 hours of collection if using EDTA tubes, or within 7 days if using cell-stabilization tubes [47].
- Perform double centrifugation: initial centrifugation at 800-1600 × g for 15-20 minutes at room temperature to separate plasma from blood cells, followed by a second centrifugation of the supernatant at 16,000 × g for 10 minutes to remove remaining cellular debris [47].
- Aliquot cleared plasma into 2 mL cryotubes and store at -80°C until DNA extraction [47] [49].
cfDNA Extraction:
- Extract cfDNA from 2-5 mL of plasma using the QIAamp Circulating Nucleic Acid Kit (Qiagen) or equivalent, following manufacturer's instructions [49].
- Quantify cfDNA concentration using fluorescence-based methods (e.g., Qubit dsDNA HS Assay Kit) [49].
- Assess DNA quality and fragment size distribution using bioanalyzer systems if needed [47].
Tumor Tissue Sequencing and Mutation Selection
Tumor DNA Extraction and Sequencing:
- Extract DNA from formalin-fixed paraffin-embedded (FFPE) tumor tissue sections using appropriate kits [27].
- Perform targeted NGS using panels such as the Ion AmpliSeq Cancer Hotspot Panel v2 (covering 50 genes) with minimum coverage of 2000× [27].
- Identify somatic mutations with variant allele frequency (VAF) >5% in tumor tissue [27].
Mutation Selection for dPCR:
- Select 1-2 mutations with the highest VAF in tumor tissue for dPCR assay design [27].
- Prioritize oncogenic driver mutations in genes such as KRAS, BRAF, PIK3CA, TP53, or APC [27] [49].
ctDNA Detection by dPCR
Assay Setup:
- Design custom dPCR assays using Bio-Rd ddPCR mutation assays or equivalent predesigned probes [27] [49].
- Prepare reaction mixtures containing 2-9 μL of extracted cfDNA, ddPCR Supermix for Probes, and mutation-specific primers/probes [27].
- Generate droplets using automated droplet generators (20,000 droplets per sample) [49].
PCR Amplification and Analysis:
- Perform thermal cycling with the following conditions: 95°C for 10 minutes, 40 cycles of 94°C for 30 seconds and annealing at assay-specific temperature (55-60°C) for 60 seconds, followed by 98°C for 10 minutes and 4°C hold [49].
- Read plates using droplet readers and analyze data with companion software (QuantaSoft for Bio-Rd systems) [27] [49].
- Set threshold for positive droplets based on negative controls, with results reported as copies/μL or variant allele frequency [49].
ctDNA Detection by NGS
Library Preparation and Sequencing:
- Prepare sequencing libraries using kits such as Ion AmpliSeq Library Kit 2.0 with incorporation of unique molecular identifiers (UMIs) [27] [50].
- Perform target enrichment using cancer hotspot panels or custom gene panels [27].
- Sequence on appropriate NGS platforms (Ion Torrent, Illumina) with minimum average coverage of 2000× for ctDNA [27].
Data Analysis and Variant Calling:
- Process raw sequencing data through bioinformatic pipelines including base calling, alignment, UMI consensus generation, and variant calling [50].
- Implement error correction methods to distinguish true low-frequency variants from sequencing artifacts [1] [50].
- Set variant calling threshold at 0.01% VAF for high-sensitivity detection, with additional filtering based on molecular read counts and background error rates [27] [50].
Visualizations
Experimental Workflow Diagram
Experimental Workflow for ctDNA Analysis
Technology Comparison Diagram
dPCR vs NGS: Advantages and Applications
The Scientist's Toolkit
Table 3: Essential Research Reagents and Solutions for ctDNA Analysis
| Category | Product/Solution | Function | Application Notes |
|---|---|---|---|
| Blood Collection | Streck Cell-Free DNA BCT Tubes | Stabilizes nucleated blood cells, prevents genomic DNA contamination | Enables sample stability for up to 7 days at room temperature [27] [47] |
| cfDNA Extraction | QIAamp Circulating Nucleic Acid Kit | Isolation and purification of cfDNA from plasma | Optimized for low-concentration cfDNA; recommended input: 2-5 mL plasma [47] [49] |
| dPCR Systems | Bio-Rad ddPCR Mutation Detection Assays | Detection of specific mutations in partitioned droplets | Custom assays designed against tumor-informed mutations; requires prior knowledge of mutation profile [27] [49] |
| NGS Panels | Ion AmpliSeq Cancer Hotspot Panel v2 | Targeted sequencing of cancer-related genes | Covers 50 genes with >2800 COSMIC variants; suitable for tumor tissue and ctDNA analysis [27] |
| DNA Quantification | Qubit dsDNA HS Assay Kit | Fluorescence-based quantification of low DNA concentrations | Essential for accurate input normalization in both dPCR and NGS workflows [49] |
| Quality Control | Bioanalyzer/TapeStation Systems | Fragment size distribution analysis | Verifies cfDNA quality (typical size: <100 bp) and confirms absence of high molecular weight DNA [47] |
The management of colorectal cancer (CRC), a leading cause of cancer-related mortality worldwide, is increasingly incorporating liquid biopsies for non-invasive detection and monitoring. Circulating tumor DNA (ctDNA) analysis presents a promising alternative to tissue biopsies, enabling real-time assessment of tumor dynamics. A significant fraction of ctDNA contains cancer-specific epigenetic alterations, with aberrant DNA methylation being one of the most clinically actionable markers. This case study explores the application of a methylation-specific droplet digital PCR (MS-ddPCR) multiplex assay for ctDNA detection in CRC, contextualizing its performance within the broader technological comparison between digital PCR (dPCR) and quantitative PCR (qPCR) for ctDNA research [51] [43].
The fundamental advantage of dPCR over qPCR lies in its method of absolute quantification. While qPCR relies on standard curves and measures amplification during the exponential phase, dPCR partitions a sample into thousands of nanoreactions, counts positive and negative endpoints, and uses Poisson statistics to provide absolute quantification without the need for standards. This partitioning makes dPCR more tolerant to PCR inhibitors and enables the detection of rare targets with a mutation rate as low as 0.1%, a significant sensitivity improvement over qPCR's typical 1% detection limit [43]. This enhanced sensitivity is critical for detecting the low fractional abundance of ctDNA in plasma, particularly in early-stage cancer or minimal residual disease (MRD) [52].
The developed MS-ddPCR multiplex assay demonstrates robust performance in detecting ctDNA across different stages of colorectal cancer. The table below summarizes key quantitative performance metrics as validated in clinical sample cohorts.
Table 1: Performance Metrics of MS-ddPCR Multiplex in Colorectal Cancer
| Performance Metric | Localized CRC | Metastatic CRC (mCRC) | Specificity |
|---|---|---|---|
| Sensitivity | 64.4% [51] | 89.2% [51] | 96.7% [51] |
| Biomarker Combination | Sensitivity | Specificity | Context of Use |
| COL25A1 & METAP1D | 49% [53] | 100% [53] | Liquid biopsy for screening and follow-up |
The high specificity of the MS-ddPCR assay is a key finding, as it translates to an excellent positive predictive value, minimizing false positives in a clinical setting [51] [53]. The assay's sensitivity shows a strong correlation with disease burden, with significantly higher detection rates in metastatic disease compared to localized tumors. This performance underscores the utility of MS-ddPCR for applications requiring high specificity, such as cancer screening, and for monitoring tumor burden in advanced disease [51].
Beyond mere detection, the dynamics of ctDNA concentration, or "ctDNA fraction," measured by this assay have profound prognostic value. In patients with metastatic CRC (mCRC), changes in ctDNA levels after the initiation of treatment are strongly associated with progression-free survival (PFS) and overall survival (OS). Patients classified as "good responders" based on a significant reduction in ctDNA fraction showed markedly superior outcomes, with a median OS of 35.3 months, compared to 6.85 months for patients with progressive disease based on ctDNA-RECIST criteria [51].
Experimental Protocol: MS-ddPCR Multiplex Assay
This section details the core methodology for implementing the MS-ddPCR multiplex assay for ctDNA detection in CRC, from sample collection to data analysis.
Sample Collection and Plasma Processing
- Blood Collection: Collect peripheral blood (e.g., 20 mL) into cell-stabilizing tubes, such as Streck Cell-Free DNA BCT tubes [53]. It is critical to process plasma samples within a defined window (e.g., within 4 hours of venepuncture) to prevent genomic DNA contamination from leukocyte lysis [54].
- Plasma Isolation: Centrifuge tubes at 2,000 g for 10 minutes to separate plasma from cellular components. Carefully transfer the supernatant (plasma) to a new tube and perform a second, higher-speed centrifugation (e.g., 10,000 g for 10 minutes or 13,000 g for 10 minutes) to remove any remaining cellular debris [54] [53].
- Storage: Aliquot the purified plasma and store at -80°C until DNA extraction to preserve nucleic acid integrity [54].
Cell-free DNA Extraction and Bisulfite Conversion
- cfDNA Extraction: Extract cell-free DNA (cfDNA) from plasma (typically 4 mL input) using specialized kits designed for low-abundance nucleic acids, such as the QIAamp Circulating Nucleic Acid Kit or the DSP Circulating DNA Kit on an automated system like the QIAsymphony SP [54] [53]. The use of an exogenous spike-in DNA control is recommended to monitor extraction efficiency [54].
- Bisulfite Conversion: Concentrate the extracted cfDNA (e.g., using a centrifugal filter unit) and bisulfite-convert it using a commercial kit (e.g., EZ DNA Methylation-Lightning Kit). Bisulfite treatment deaminates unmethylated cytosines to uracils, while methylated cytosines remain unchanged, creating sequence differences that can be detected by PCR [54] [55]. The converted DNA is eluted in a small volume (e.g., 15-20 µL) to maximize concentration [54].
Methylation-Specific ddPCR Assay
- Assay Design: The MS-ddPCR assay uses primers and probes targeted to the bisulfite-converted sequence of interest. A robust design involves:
- Primers: Designed to be "methylation-independent" by avoiding CpG sites in their sequence. This ensures they anneal to the bisulfite-converted DNA regardless of methylation status, amplifying only the converted template [52].
- Probes: Two TaqMan probes are designed for each marker: a FAM-labeled probe to bind the methylated sequence (where the CpG-site C remains a C) and a HEX-labeled probe to bind the unmethylated sequence (where the CpG-site C is converted to T) [55] [52].
- ddPCR Reaction Setup: Prepare a reaction mix containing:
- ddPCR Supermix for Probes (no dUTP)
- Primer and probe sets for multiple methylation biomarkers (e.g., a 5-plex panel)
- Bisulfite-converted cfDNA template (typically 4-100 ng)
- Nuclease-free water to a final volume of 22 µL [55]
- Droplet Generation and Thermocycling: Load the reaction mix into a droplet generator (e.g., QX200 AutoDG) to create ~20,000 nanodroplets per sample. Perform PCR amplification on a thermal cycler with the following profile:
- Droplet Reading and Analysis: Read the plate on a droplet reader (e.g., QX200 Droplet Reader). Use analysis software (e.g., QuantaSoft) to count the number of FAM-positive (methylated) and HEX-positive (unmethylated) droplets. The absolute concentration of methylated and unmethylated alleles (in copies/µL) is calculated using Poisson statistics [55].
Diagram 1: MS-ddPCR Workflow for ctDNA Detection.
Data Interpretation and ctDNA Status Calling
The methylation fraction is calculated for each marker. For a single marker, this can be expressed as the Methylation Index (MI): MI = (concentration of methylated alleles / concentration of reference gene alleles) [55]. In a multiplex setting, the results from multiple markers are combined into a panel score. Determining ctDNA "positivity" is a critical step, and the choice of cut-off method (e.g., based on the number of positive markers or the total mutant molecule count) can impact sensitivity and specificity. Studies have shown that using different statistical cut-offs can yield positive rates of 38.7% vs. 46.8% in non-metastatic disease and 70.2% vs. 83.0% in metastatic disease, highlighting the need for standardized, pre-defined thresholds [54].
The Scientist's Toolkit: Essential Research Reagents
The successful implementation of the MS-ddPCR assay relies on a set of core reagents and instruments. The following table catalogs the essential components and their functions within the experimental pipeline.
Table 2: Key Research Reagent Solutions for MS-ddPCR
| Reagent / Instrument | Function / Application | Exemplar Products |
|---|---|---|
| Cell-Free DNA Blood Collection Tubes | Stabilizes blood cells to prevent lysis and preserve cfDNA profile during transport and storage. | Streck Cell-Free DNA BCT [27] [53] |
| Circulating Nucleic Acid Extraction Kit | Isolves low-abundance, fragmented cfDNA from plasma with high efficiency and purity. | QIAamp Circulating Nucleic Acid Kit, DSP Circulating DNA Kit [54] [53] |
| Bisulfite Conversion Kit | Chemically converts unmethylated cytosine to uracil for subsequent methylation-specific detection. | EZ DNA Methylation-Lightning Kit, EZ DNA Methylation-Gold Kit [54] [55] |
| ddPCR System | Partitions samples, performs thermocycling, and provides absolute quantification of target molecules. | Bio-Rad QX200 System [55] |
| Methylation-Specific Assays | Primers and dual-labeled probes (FAM/HEX) for targeted amplification of methylated and unmethylated sequences. | Custom-designed assays [55] [52] |
dPCR vs. qPCR: A Technical Comparison for ctDNA Detection
The choice between dPCR and qPCR is application-dependent. For ctDNA detection, where sensitivity, precision, and absolute quantification are paramount, dPCR offers distinct advantages, as summarized in the table below.
Table 3: dPCR vs. qPCR for ctDNA Analysis
| Feature | Digital PCR (dPCR) | Quantitative PCR (qPCR) |
|---|---|---|
| Quantification Method | Absolute, without need for standard curves [43] | Relative, requires standard curves or reference samples [43] |
| Sensitivity for Rare Alleles | High (detection limit ≥ 0.1%) [43] | Lower (detection limit > 1%) [43] |
| Tolerance to PCR Inhibitors | High (due to sample partitioning) [43] | Lower [43] |
| Impact of Amplification Efficiency | Low (end-point detection) [43] | High (data collected during exponential phase) [43] |
| Precision & Reproducibility | Higher precision for fractional abundance and low-copy targets [43] | Well-established protocols, but lower precision for rare targets [43] |
| Best Suited For | Rare mutation detection, copy number variation, absolute quantification [43] | Gene expression analysis, pathogen detection, microbiome analysis [43] |
The partitioning step in dPCR not only enables absolute quantification but also significantly enhances robustness. It reduces the impact of PCR inhibitors and variations in amplification efficiency, which is particularly beneficial when analyzing challenging samples like cfDNA or DNA from formalin-fixed paraffin-embedded (FFPE) tissue [43] [52]. A direct comparison study on rectal cancer samples found that a tumor-informed ddPCR assay detected ctDNA in 58.5% of baseline plasma samples, significantly outperforming a 36.6% detection rate for an NGS panel (p=0.00075) [27] [23]. Furthermore, for methylation analysis on low-input or degraded DNA samples, ddPCR has been shown to provide more accurate measurements than qPCR [52].
Biomarker Discovery and Panel Design
The development of a highly specific MS-ddPCR assay begins with the identification of robust methylation biomarkers. A common strategy involves in-silico analysis of public methylation array databases, such as The Cancer Genome Atlas (TCGA) and Gene Expression Omnibus (GEO). The process typically includes:
- Differential Methylation Analysis: Identifying CpG sites with large mean beta-value differences (e.g., >0.5) between CRC tissue and normal tissues (including normal colorectal tissue and whole blood) [54] [53].
- Feature Selection: Using algorithms like Recursive Feature Elimination (RFE) with cross-validation to select the minimal set of CpGs that best separates cancer from normal samples [54].
- Panel Validation: Confirming the performance of the selected biomarker panel on an independent validation cohort from a different database before moving to laboratory validation on tissue and plasma samples [53].
This bioinformatics-driven approach has successfully identified novel biomarker combinations for CRC, such as COL25A1 and METAP1D, which showed perfect specificity (AUC=1) in silico and 100% specificity in initial plasma validation [53]. For lung cancer, a similar process identified a 5-marker panel including HOXA9 [54], demonstrating the generalizability of the workflow.
Diagram 2: Biomarker Discovery and Assay Development Pathway.
The analysis of circulating tumor DNA (ctDNA) presents a profound challenge: extracting maximal, reliable information from exceptionally limited and precious patient samples. Within the context of ctDNA research for cancer detection and monitoring, multiplexing—the simultaneous detection of multiple analytes in a single reaction—has transitioned from a convenience to a necessity. This approach is critical for comprehensive tumor profiling, detecting heterogeneous mutations, and monitoring treatment resistance, all while conserving sample volume and reducing costs [9]. The choice between digital PCR (dPCR) and quantitative PCR (qPCR) fundamentally shapes the multiplexing strategy employed. While qPCR offers a wider dynamic range and is more cost-effective for initial screening, dPCR provides superior precision, accuracy, and resilience to PCR inhibitors, making it exceptionally suited for quantifying rare mutant alleles in a background of wild-type DNA [56] [9]. This application note details the practical frameworks and protocols for implementing multiplexing strategies to maximize the yield from valuable ctDNA samples.
Core Principles of Multiplex Assay Design
Multiplexing in PCR-based assays involves the co-amplification of multiple nucleic acid targets within a single reaction. The design logic bifurcates based on the genetic context of the targets.
Non-Competing Duplex Reactions: These assays utilize two distinct primer pairs to amplify separate genomic regions (e.g., a target mutation and a reference gene). Each target is detected with a uniquely labeled probe, typically with different fluorescent dyes. The resulting data, when visualized in two dimensions, shows four distinct clusters: double-negative, two single-positive, and a double-positive cluster. This configuration is ideal for applications like copy number variation analysis [57].
Competing Duplex Reactions: Designed for variant detection, these assays employ a single primer pair that flanks the variant site, coupled with two sequence-specific probes. One probe is specific for the wild-type sequence and another for the mutant, each with a different fluorophore. This setup is the cornerstone for detecting single nucleotide variants (SNVs) and small indels, as used in identifying EGFR mutations in lung cancer [57].
Table 1: Comparison of dPCR and qPCR for Multiplexed ctDNA Analysis
| Parameter | Digital PCR (dPCR) | Quantitative PCR (qPCR) |
|---|---|---|
| Quantification | Absolute, without a standard curve [9] | Relative, requires a standard curve [9] |
| Precision & Accuracy | Higher precision; handles inhibition better [56] | Lower precision in complex samples [56] |
| Sensitivity | Superior for rare variant detection [9] | High, but can be limited by background [9] |
| Dynamic Range | Wide, but can be narrower than qPCR [56] | Wider linear dynamic range [56] |
| Multiplexing Scale | Typically 2-plex (up to 6-plex with spectral imaging) [57] | Higher-plexing possible with multiple channels [9] |
| Cost & Throughput | Higher cost per sample; lower throughput [9] | More cost-effective; higher throughput [9] |
Experimental Protocols for Multiplex dPCR
The following protocol is optimized for the detection of rare SNVs (e.g., KRAS G12D) in a background of wild-type DNA using a competing duplex assay on a droplet digital PCR system.
Sample Preparation and Pre-Assay Considerations
- ctDNA Extraction: Isolate ctDNA from patient plasma using a commercially available cell-free DNA extraction kit. Prefer magnetic bead-based methods for optimal yield and purity.
- Quality Assessment: Quantify the extracted ctDNA using a fluorometric method suitable for low-concentration samples. The A260/A280 ratio should be ~1.8-2.0.
- Assay Design: Design primers and TaqMan hydrolysis probes against the mutant and wild-type sequences.
- Primers: Should flank the variant site with a melting temperature (Tm) of 58-60°C.
- Probes: The mutant and wild-type probes must have the same Tm, which should be ~10°C higher than the primers. Label the wild-type probe with FAM and the mutant probe with HEX or VIC. Avoid G at the 5' end of the probe.
- In-Silico Validation: Check for primer-dimer and hairpin formation using tools like MFEprimer-2.0 (ΔG > -5 kcal/mol is acceptable) [56].
Digital PCR Workflow
Reaction Setup:
- Prepare a 20 µL reaction mix containing:
- 10 µL of 2x ddPCR Supermix (no dUTP).
- 1 µL of 20x Wild-Type Probe (FAM-labeled).
- 1 µL of 20x Mutant Probe (HEX-labeled).
- 2 µL of extracted ctDNA template (up to 100 ng).
- Nuclease-free water to 20 µL.
- Mix thoroughly by pipetting, then briefly centrifuge.
- Prepare a 20 µL reaction mix containing:
Droplet Generation:
- Transfer the entire 20 µL reaction to the designated well of a DG8 cartridge.
- Following the manufacturer's protocol, generate droplets using the droplet generator oil.
PCR Amplification:
- Transfer the emulsified reaction to a 96-well PCR plate.
- Seal the plate with a foil heat seal.
- Run the following thermal cycling protocol:
- Step 1: Enzyme activation at 95°C for 10 minutes.
- Step 2: 40 cycles of:
- Denaturation: 94°C for 30 seconds.
- Annealing/Extension: 60°C for 60 seconds (acquire fluorescence).
- Step 3: Enzyme deactivation: 98°C for 10 minutes.
- Step 4: Hold at 4°C.
Droplet Reading and Analysis:
- Load the plate into the droplet reader.
- Analyze the raw fluorescence data using the manufacturer's software.
- Set thresholds to clearly distinguish the four populations: wild-type positive (FAM+), mutant positive (HEX+), double-negative, and double-positive.
- The software will provide an absolute count of mutant and wild-type molecules, from which the mutant allele frequency can be calculated.
Diagram 1: dPCR Workflow for ctDNA Analysis
The Scientist's Toolkit: Essential Reagents and Materials
Table 2: Key Research Reagent Solutions for Multiplex dPCR
| Reagent/Material | Function | Example & Notes |
|---|---|---|
| ddPCR Supermix | Provides optimized buffer, enzymes, and dNTPs for robust amplification in partitioned reactions. | Bio-Rad ddPCR Supermix for Probes (no dUTP) is standard. Ensures consistent droplet stability. |
| TaqMan Probes | Sequence-specific detection of wild-type and mutant alleles. | FAM-labeled wild-type probe; HEX/VIC-labeled mutant probe. Must be HPLC-purified. |
| Droplet Generation Oil | Creates the water-in-oil emulsion necessary for partitioning the reaction. | Bio-Rad Droplet Generation Oil for Probes. Critical for consistent droplet formation. |
| Cell-free DNA Blood Kits | For the isolation of high-quality, pure ctDNA from plasma samples. | QIAamp Circulating Nucleic Acid Kit (Qiagen). Maximizes yield from limited volumes. |
| dgPCR Cartridges & Plates | Consumables for droplet generation and thermal cycling. | Bio-Rad DG8 Cartridges and Twin.tec PCR Plates. Ensure compatibility with the instrument platform. |
Data Analysis and Visualization in Multiplex dPCR
A core strength of dPCR is its direct, visual data output. In a well-optimized competing duplex assay, the results are displayed on a 2D scatter plot.
Cluster Identification: The software identifies four distinct clusters of droplets:
- Double Negative (Q4): Droplets containing no template DNA.
- Wild-type Positive (Q2): Droplets positive only for the FAM channel (wild-type allele).
- Mutant Positive (Q3): Droplets positive only for the HEX/VIC channel (mutant allele).
- Double Positive (Q1): Droplets containing both wild-type and mutant molecules; their presence can indicate the presence of heterozygotes or, in rare cases, multiple molecules in a single droplet.
Poisson Correction: The software applies a Poisson correction to the raw positive counts to account for droplets that contained more than one molecule of the same type, thereby calculating the absolute concentration of each target (copies/µL) [57]. The mutant allele frequency (MAF) is calculated as:
[Mutant] / ([Mutant] + [Wild-type]) * 100.
Diagram 2: dPCR 2D Scatter Plot Analysis
Advanced Applications and Future Directions
The frontier of multiplexing in ctDNA analysis extends beyond duplexing. Higher-order multiplexing in dPCR, while technically demanding, allows for the simultaneous screening of a panel of hotspot mutations from a single sample aliquot [57]. This is achieved through advanced fluorescence coding schemes, such as varying probe concentrations or using ratio-based signals in addition to color. Furthermore, the integration of multiplexed dPCR assays with next-generation sequencing (NGS) creates a powerful synergistic workflow: dPCR provides ultrasensitive, absolute quantification for tracking known mutations during therapy, while NGS offers an unbiased discovery tool for identifying novel and resistance-associated mutations. As the field progresses, the drive towards standardized, automated, and even more highly multiplexed reactions will continue to enhance the utility of ctDNA analysis in personalized oncology.
Optimizing Assay Performance: Troubleshooting Common Pitfalls
The accurate detection and quantification of circulating tumor DNA (ctDNA) present a significant challenge in molecular diagnostics, requiring assays of exceptional sensitivity and specificity. ctDNA often constitutes less than 0.1% of total cell-free DNA in blood, demanding rigorous optimization of primer and probe systems [1]. Well-designed assays form the foundational element for reliable data in both quantitative PCR (qPCR) and digital PCR (dPCR) platforms, directly impacting the accuracy of tumor burden monitoring, treatment response assessment, and minimal residual disease detection [27] [1]. This document outlines fundamental principles and detailed protocols for optimizing primers and probes, specifically tailored for ctDNA research applications.
Core Principles of Primer and Probe Design
Fundamental Design Guidelines
Successful PCR assay design begins with adhering to established principles that ensure efficient amplification and specific binding.
Table 1: Core Design Parameters for Primers and Probes
| Parameter | Primer Guidelines | Probe Guidelines |
|---|---|---|
| Length | 18–30 bases [58] | 20–30 bases for single-quenched; longer possible with double-quenched [58] |
| Melting Temperature (Tm) | 60–64°C; ideal 62°C [58] | 5–10°C higher than primers [58] |
| Annealing Temperature (Ta) | ≤ 5°C below primer Tm [58] | Set ≤ 5°C below the lower primer Tm [58] |
| GC Content | 35–65%; ideal 50% [58] | 35–65%; avoid G at 5' end [58] |
| Amplicon Length | 70–150 bp (optimal); up to 500 bp possible [58] | N/A |
| Specificity Checks | Avoid runs of 4+ G's; check for self-dimers, hairpins (ΔG ≥ -9.0 kcal/mol) [58] | Check for self-dimers, hairpins (ΔG ≥ -9.0 kcal/mol) [58] |
Additional critical considerations include:
- Sequence Specificity: Use BLAST analysis to ensure primers are unique to the target sequence [58].
- Secondary Structures: Analyze oligonucleotides for self-dimers, heterodimers, and hairpin formations. The free energy (ΔG) for any such structure should be weaker (more positive) than -9.0 kcal/mol to prevent stable, non-productive structures from forming [59] [58].
- Genomic DNA Mitigation: For gene expression studies using RT-qPCR, design assays to span an exon-exon junction where possible to reduce amplification from contaminating genomic DNA [58].
Platform-Specific Considerations: qPCR vs. dPCR for ctDNA
While the core principles of primer and probe design are consistent across platforms, the transfer of a validated qPCR method to dPCR requires specific attention.
- Maintained Conditions: When converting a validated qPCR method to dPCR, key reaction conditions must be maintained, including primer/probe sequences, their concentrations, and the annealing temperature [60].
- Adjustable Conditions: Conditions that can be adapted include probe labeling, the number of PCR cycles, the choice of reference gene method, and device-specific master mix and reaction volume [60].
- dPCR Verification: Following transfer, dPCR methods should be verified for performance characteristics such as resolution, rain, limit of detection (LOD), and limit of quantification (LOQ) to meet minimum performance requirements [60]. A 2024 study on rectal cancer ctDNA highlighted the practical performance differences, finding ddPCR detected ctDNA in 58.5% of baseline plasma samples compared to 36.6% for an NGS panel (p=0.00075) [27].
Experimental Protocols for Optimization
Protocol 1: Primer and Probe Concentration Optimization
This protocol is essential for achieving maximum sensitivity and specificity, especially for low-abundance targets like ctDNA.
Step-by-Step Procedure:
- Preparation: Reconstitute primers and probes to a high-concentration stock (e.g., 100 µM).
- Plate Setup: Prepare a series of master mixes testing a range of primer concentrations (e.g., 50 nM, 100 nM, 200 nM, 400 nM, 600 nM) and probe concentrations (e.g., 50 nM, 100 nM, 200 nM). A matrix layout is often necessary [59].
- Execution: Pipette the mixes into a qPCR plate, add template (including a no-template control, NTC), and run the qPCR protocol using standardized cycling conditions.
- Analysis: Select the concentration combination that yields the lowest Cq (quantification cycle) value, the highest amplification efficiency, the strongest endpoint fluorescence, and a negative NTC [59].
Troubleshooting Tips:
- High Cq/Low Fluorescence: This may indicate inefficient amplification. Try increasing primer and/or probe concentrations within the recommended range.
- Non-Specific Amplification (in NTC): This indicates a lack of specificity. First, try increasing the annealing temperature. If this fails, re-design the primers to avoid secondary structures and strong 3'-end complementarity [59].
Protocol 2: Annealing Temperature (Ta) Optimization
This protocol is crucial when using SYBR Green I dye-based detection or when a new primer pair does not perform well under standard conditions.
Step-by-Step Procedure:
- Setup: Prepare a single master mix containing the primers and probe (or SYBR Green I) at their predetermined or standard concentrations.
- Gradient Setup: Aliquot the master mix into multiple wells and use a thermal cycler with a gradient function to run simultaneous reactions across a range of annealing temperatures (e.g., from 55°C to 65°C) [59].
- Execution: Run the qPCR protocol with the temperature gradient.
- Analysis: For probe-based assays, select the temperature that produces the lowest Cq and highest fluorescence. For SYBR Green I assays, also perform a melt curve analysis post-run. The optimal Ta is the highest temperature that yields a single, specific peak in the melt curve and a low Cq [59].
Protocol 3: Assay Validation and Performance Assessment
Once optimal conditions are found, the final assay must be rigorously validated.
Step-by-Step Procedure:
- Standard Curve Creation: Serially dilute (e.g., 1:10 dilutions) a known quantity of target material (e.g., synthetic gBlock, plasmid) over 5+ orders of magnitude [61].
- Execution: Run the dilution series in triplicate using the optimized qPCR assay.
- Data Analysis: The software will generate a standard curve from the Cq values of the dilutions.
- Performance Criteria: A robust assay should have an amplification efficiency (E) between 90-105% (corresponding to a slope of -3.6 to -3.1) and a correlation coefficient (R2) of ≥ 0.990 [62] [59]. These parameters are prerequisites for reliable relative quantification using the 2–ΔΔCt method [61].
Performance Data and Comparison
Table 2: Key Performance Characteristics for qPCR/dPCR Assay Validation
| Performance Characteristic | Target Value | Interpretation & Impact |
|---|---|---|
| Amplification Efficiency (E) | 90–105% [62] | Efficiency outside this range leads to inaccurate quantification in relative expression studies. |
| Correlation Coefficient (R2) | ≥ 0.990 [62] | Indicates high linearity and precision across the dynamic range. |
| Dynamic Range | 5-6 log decades [59] | The range of template concentrations over which the assay is accurate and precise. |
| Limit of Detection (LOD) | Varies by application | For ctDNA, must be sensitive enough to detect low VAF (e.g., 0.01% for ddPCR [27]). |
| Intra-assay CV (Cq) | < 2.5% | Measures repeatability (precision within a single run). |
| Inter-assay CV (Cq) | < 5.0% | Measures reproducibility (precision across different runs/days). |
Workflow and Logical Diagrams
Assay Design and Optimization Workflow
The following diagram outlines the comprehensive, iterative process of designing and optimizing a PCR assay, from in silico design to functional validation.
Decision Logic for qPCR vs. dPCR Selection
This flowchart provides a structured guide for researchers to select the most appropriate PCR technology based on their specific application requirements and constraints.
The Scientist's Toolkit: Essential Research Reagents
Table 3: Key Research Reagent Solutions for PCR Assay Development
| Reagent / Tool Category | Specific Examples | Function & Importance |
|---|---|---|
| Oligo Design Software | Primer3Plus, Primer-BLAST, OligoAnalyzer Tool [62] [58] | In silico design and analysis of primers/probes for specificity, Tm, and secondary structures. |
| Hot-Start DNA Polymerase | Various commercial master mixes | Reduces non-specific amplification by limiting polymerase activity until first denaturation step. |
| Fluorescent Detection Chemistries | SYBR Green I, TaqMan Probes (single/double-quenched), Molecular Beacons [61] | Enable real-time detection of amplified DNA. Double-quenched probes lower background fluorescence [58]. |
| Commercial Assay Design Services | Thermo Fisher TaqMan Assay Design, IDT PrimerQuest [63] [58] | Provide expert-designed, often predesigned assays, saving time and resources for common targets. |
| Synthetic Target Controls | gBlocks, Plasmid DNA, Synthetic Oligos | Used for creating standard curves to validate assay efficiency, sensitivity, and dynamic range. |
| Optimal Buffer Systems | Manufacturer-specific PCR buffers | Provide optimal ionic conditions (Mg2+, K+) for polymerase activity and primer annealing. |
The accurate detection and quantification of circulating tumor DNA (ctDNA) is paramount for non-invasive cancer diagnostics, treatment monitoring, and residual disease detection. However, the reliability of polymerase chain reaction (PCR)-based methods can be severely compromised by the presence of PCR inhibitors, which are substances that interfere with amplification. This application note details how the fundamental principle of partitioning in digital PCR (dPCR) confers superior robustness against these inhibitors compared to quantitative PCR (qPCR), with a specific focus on circulating tumor HPV DNA (ctHPVDNA) and other ctDNA targets. We provide quantitative data comparisons, detailed protocols for assessing inhibition, and a toolkit of reagent solutions to ensure data integrity in critical clinical research.
The analysis of ctDNA from liquid biopsies, such as blood plasma, presents a unique analytical challenge. The sample matrix and co-purified substances often contain PCR inhibitors that can skew results, leading to false negatives or inaccurate quantification [64]. Common inhibitors include immunoglobulin G, lactoferrin, haemoglobin, heparin, and humic substances, which can originate from the sample itself or be introduced during sample processing [64]. These inhibitors operate through several mechanisms, including:
- Inhibition of DNA polymerase activity, reducing amplification efficiency.
- Interaction with nucleic acids, preventing denaturation or primer annealing.
- Fluorescence quenching, interfering with the detection of amplification products in qPCR and sequencing-by-synthesis platforms [64].
While the classical solution involves sample purification or dilution, these methods often lead to irreversible DNA loss, which is particularly detrimental when analyzing the low-abundance ctDNA typical of minimal residual disease or early-stage cancer [64]. Understanding and mitigating the effects of inhibitors is therefore not just a technical exercise but a necessity for robust clinical research.
Mechanism of Action: How Partitioning Confers Robustness
The core technological difference between qPCR and dPCR lies in sample partitioning. In qPCR, the reaction is performed in a single, bulk volume. The presence of an inhibitor in this volume affects the entire reaction, typically observed as a delay in the quantification cycle (Cq) or a complete amplification failure [64]. In contrast, dPCR divides the sample into thousands to millions of minute, individual partitions, so that each partition acts as an independent PCR microreactor.
This partitioning confers robustness through two primary mechanisms:
- Dilution of Inhibitors: The partitioning process naturally dilutes inhibitor molecules across the many thousands of reactions. A large number of partitions will contain either no inhibitors or a sub-critical concentration, allowing amplification to proceed unhindered in those partitions [65]. This contrasts with a bulk qPCR reaction, where inhibitors are present at their full concentration throughout the entire volume.
- Endpoint Quantification: dPCR does not rely on the kinetics of amplification (i.e., Cq values) for quantification. Instead, it uses an end-point, binary readout (positive or negative) for each partition [64] [43]. A partition is scored as positive if the amplification signal crosses a fluorescence threshold, regardless of how many cycles it took to get there. Inhibitors may cause a delay, manifesting as a lower fluorescence intensity in positive partitions, but they do not prevent the binary calling of a positive result at the end of the amplification [64]. Statistical models (e.g., Poisson distribution) are then applied to the ratio of positive to negative partitions to provide an absolute quantification of the target molecule, independent of amplification efficiency variations [66] [67].
The following diagram illustrates this core mechanism and its analytical impact.
Comparative Performance Data: dPCR vs. qPCR
The theoretical advantages of dPCR translate into measurable performance benefits in clinical research, particularly for ctDNA analysis.
Meta-Analysis of ctHPVDNA Detection
A 2024 meta-analysis directly compared the diagnostic performance of qPCR, droplet digital PCR (ddPCR), and next-generation sequencing (NGS) for detecting circulating tumor HPV DNA (ctHPVDNA) in patients with HPV-associated cancers. The pooled sensitivity results from 36 studies (2,986 patients) are summarized below [44].
Table 1: Diagnostic Sensitivity for Pretreatment ctHPVDNA Detection (Meta-Analysis) [44]
| Detection Platform | Pooled Sensitivity (95% CI) | Statistical Significance |
|---|---|---|
| qPCR | 0.51 (0.37–0.64) | Reference |
| ddPCR | 0.81 (0.73–0.87) | P < 0.001 vs. qPCR |
| NGS | 0.94 (0.88–0.97) | P = 0.014 vs. ddPCR |
This data demonstrates a clear and statistically significant hierarchy in sensitivity, with dPCR substantially outperforming qPCR. The superior performance of dPCR is frequently attributed to its higher tolerance to inhibitors and its ability to precisely quantify low-abundance targets without a standard curve [44].
General Performance in Inhibitory Conditions
Beyond specific ctDNA applications, the robustness of dPCR has been demonstrated across various sample types known to be challenging for qPCR.
Table 2: Comparative Performance of qPCR vs. dPCR in Challenging Samples
| Performance Characteristic | qPCR / RT-qPCR | Digital PCR (dPCR/ddPCR) |
|---|---|---|
| Fundamental Quantification | Relative (requires standard curve) [43] | Absolute (no standard curve) [67] [43] |
| Impact of PCR Efficiency | Highly impacted; skews Cq and quantification [64] [43] | Largely unaffected due to endpoint detection [64] [43] |
| Tolerance to PCR Inhibitors | Lower; inhibitors affect the entire reaction [64] | Higher; inhibitors are diluted and their effect mitigated [64] [65] |
| Detection of Rare Mutants | Mutation rate ≥ 1% [43] | Mutation rate ≥ 0.1% [43] |
| Limit of Detection (LoD) | Higher LoD, broad dynamic range [9] | Lower LoD, suited for rare target detection [9] [68] |
| Application in Wastewater | Requires extensive optimization and dilution to overcome inhibition [69] | More robust; provides accurate quantification in complex matrices [69] [65] |
Experimental Protocols
Protocol: Assessing Inhibition in ctDNA Samples Using dPCR
This protocol is designed to evaluate the presence and impact of PCR inhibitors in a patient plasma sample intended for ctDNA analysis.
I. Sample Preparation and DNA Extraction
- Plasma Isolation: Collect whole blood in EDTA or Streck Cell-Free DNA BCT tubes. Centrifuge twice to isolate platelet-poor plasma.
- Cell-Free DNA (cfDNA) Extraction: Extract cfDNA from 2-4 mL of plasma using a silica-membrane column kit optimized for low-volume samples. Elute in a low-EDTA buffer or nuclease-free water.
- Sample Splitting: Split the extracted cfDNA into two equal aliquots.
- Spike-in Control: To one aliquot, add a known, low copy number (e.g., 50 copies/µL) of a synthetic, non-human DNA sequence (e.g., GBlock, PrimeTime). This is the "spiked" sample. The other aliquot remains unmodified ("unspiked").
II. dPCR Setup and Run
- Reaction Mix Preparation: Prepare a dPCR master mix according to manufacturer specifications. Include assays for:
- Your ctDNA target of interest (e.g., an oncogenic mutation).
- The spike-in control sequence.
- (Optional) A reference gene for quality control.
- Partitioning and Amplification: Load the master mix with the "spiked" and "unspiked" sample aliquots into the dPCR system (e.g., droplet generator or nanoplate system). Perform partitioning according to the platform's protocol. Run the PCR amplification with the recommended cycling conditions.
III. Data Analysis and Interpretation
- Concentration Calculation: Use the dPCR software to calculate the absolute concentration (copies/µL) for the ctDNA target and the spike-in control in both samples.
- Inhibition Assessment: Compare the measured concentration of the spike-in control between the "spiked" sample and its expected, theoretical concentration. A significant recovery of >80% indicates minimal inhibition. A recovery of <80% suggests the presence of PCR inhibitors in the sample extract.
- Result Validation: If inhibition is detected, the ctDNA quantification from the "unspiked" sample should be interpreted with caution. Consider further diluting the DNA extract or using an inhibitor-tolerant polymerase blend for re-analysis.
Protocol: Evaluating PCR Enhancers for Inhibited Samples
Based on research into wastewater (a highly inhibitory matrix), this protocol evaluates additives to rescue amplification in inhibited samples [69].
I. Preparation of Enhancer Stocks Prepare stock solutions of the following enhancers in nuclease-free water:
- Bovine Serum Albumin (BSA): 10-20 mg/mL
- T4 Gene 32 Protein (gp32): 0.5-1 µM
- Dimethyl Sulfoxide (DMSO): 10% (v/v)
- Tween-20: 0.1-1% (v/v)
II. dPCR Reaction Setup with Enhancers
- Set up a series of identical dPCR reaction mixes containing the inhibited sample.
- Add a different enhancer from the list above to each reaction. Include a negative control (no enhancer) and a positive control (uninhibited sample).
- Recommended starting concentrations in the final reaction are:
- BSA: 0.1-0.5 µg/µL
- gp32: 25-50 nM
- DMSO: 2-5% (v/v)
- Tween-20: 0.05-0.1% (v/v)
- Run the dPCR as described in Protocol 4.1.
III. Analysis of Enhancer Efficacy
- Calculate the target concentration for each reaction with a different enhancer.
- The most effective enhancer will be the one that yields the highest target concentration compared to the inhibited negative control, ideally matching the value from the positive uninhibited control without introducing non-specific amplification.
The Scientist's Toolkit: Research Reagent Solutions
The following table lists key reagents and materials that are essential for developing robust dPCR assays for ctDNA detection in the presence of potential inhibitors.
Table 3: Essential Reagents for Robust ctDNA dPCR Assays
| Reagent / Material | Function & Rationale |
|---|---|
| Inhibitor-Tolerant DNA Polymerase Blends | Engineered enzyme formulations containing single-stranded binding proteins or other stabilizers that maintain activity in the presence of common inhibitors found in blood (hemoglobin, IgG, lactoferrin) [64]. |
| Silica-Membrane cfDNA Extraction Kits | Efficiently purifies and concentrates low-abundance cfDNA while removing a significant portion of PCR inhibitors from plasma/serum. Kits specifically designed for cell-free DNA are recommended. |
| PCR Enhancers (BSA, gp32) | Acts as a "molecular sponge," binding to inhibitory substances and preventing them from interacting with the DNA polymerase or nucleic acids [69]. |
| Synthetic Spike-in Control | A non-human exogenous DNA sequence used to monitor PCR efficiency and detect inhibition within each sample, as detailed in Protocol 4.1. |
| Multiplexed Assays (FAM, VIC/HEX) | Fluorogenic probe-based assays (e.g., TaqMan) for simultaneous detection of the ctDNA target, a spike-in control, and/or a reference gene in a single well, conserving precious sample [65]. |
| Nuclease-Free Water (Low-EDTA Elution Buffer) | Provides an inhibitor-free medium for eluting and storing extracted DNA. Low-EDTA buffers are preferred as high concentrations of EDTA can chelate Mg²⁺, a co-factor for DNA polymerase. |
Partitioning is the cornerstone of dPCR's robustness against PCR inhibitors. By diluting inhibitors across thousands of reactions and relying on endpoint quantification, dPCR provides more accurate and reliable data for ctDNA analysis compared to qPCR, especially in challenging sample matrices. This technical advantage is reflected in its superior diagnostic sensitivity in clinical meta-analyses. The protocols and reagents outlined in this document provide a framework for researchers to validate their assays, troubleshoot inhibition, and confidently generate high-quality data for critical drug development and clinical research applications.
The accurate detection of circulating tumor DNA (ctDNA) presents a significant challenge in oncology, requiring meticulous experimental control to ensure reliability. In the context of a broader research thesis comparing Digital PCR (dPCR) and quantitative PCR (qPCR), the implementation of essential controls like No Template Controls (NTCs) and calibration standards becomes paramount. These controls are the foundation for validating data, preventing false positives, and ensuring the precision required for clinical and research applications in areas such as rectal cancer monitoring and hepatitis D virus (HDV) load quantification [27] [70]. This document outlines detailed protocols and application notes for incorporating these critical elements into your dPCR and qPCR workflows for ctDNA detection.
The Critical Role of Controls in ctDNA Detection
The low abundance of ctDNA in a background of wild-type cell-free DNA creates a technically demanding detection environment. False-positive results can arise from amplicon or sample cross-contamination, while false-negative findings may stem from PCR inhibition or suboptimal assay efficiency. Proper controls directly address these issues:
- No Template Controls (NTCs) are essential for ruling out cross-contamination of reagents and surfaces. The NTC includes all RT-PCR reagents except the nucleic acid template, which is substituted with nuclease-free water. No product should be amplified in the NTC; the presence of a product indicates contamination of one or more reagents with the amplicon or other DNA [71].
- Calibration Standards are indispensable for absolute quantification in dPCR and for generating standard curves in qPCR. They allow researchers to determine key assay parameters such as the Limit of Detection (LOD) and Limit of Quantification (LOQ), and to convert measured units (e.g., copies/mL) to internationally recognized units (IU/mL) using international standards, as demonstrated in HDV RNA assays [70].
When comparing dPCR and qPCR, dPCR offers absolute quantification without the need for a standard curve, demonstrating reduced susceptibility to PCR inhibitors and improved accuracy [60]. However, the initial validation of the dPCR system itself, including an assessment of sensitivity, trueness, and precision, is recommended before its application to specific assays [60].
Experimental Protocols
Protocol: Implementing and Running No Template Controls
Objective: To detect and prevent false positives caused by contaminating nucleic acids in reagents or the environment.
- Step 1: Preparation. Prepare the master mix for all samples, including the NTCs. The use of a master mix helps minimize sample-to-sample and well-to-well variation and improves reproducibility [71].
- Step 2: NTC Setup. Aliquot the master mix into the designated NTC reaction tube or well. Substitute the nucleic acid template (e.g., plasma-derived cfDNA) with the same volume of nuclease-free water [71].
- Step 3: Amplification. Run the NTC alongside all experimental samples through the entire dPCR or qPCR process using identical cycling conditions.
- Step 4: Analysis and Interpretation.
- For dPCR: Analyze the NTC for the presence of any positive droplets or clusters. The NTC should yield zero or a negligible number of positive partitions, consistent with background noise [60].
- For qPCR: The NTC should show no amplification curve, or its quantification cycle (Cq) value should be undetermined. A Cq value in the NTC that is within a few cycles of your sample signals significant contamination [71].
Table 1: Troubleshooting NTC Results
| Issue | Potential Cause | Corrective Action |
|---|---|---|
| Amplification in NTC | Contaminated reagents, amplicon carryover | Decontaminate surfaces with a DNA degradation solution; prepare fresh reagents; use uracil-DNA glycosylase (UDG) treatment [71]. |
| High background in dPCR NTC | Non-specific amplification, primer-dimer | Re-optimize primer/probe concentrations and annealing temperature [72]. |
Protocol: Utilizing Standards for Quantification and Validation
Objective: To ensure accurate and traceable quantification of ctDNA.
- Step 1: Standard Selection.
- For dPCR: Use serially diluted standards of known concentration (e.g., synthetic gBlocks or reference materials) to validate the system's linearity and dynamic range. For traceability, use an international standard (e.g., WHO HDV International Standard) to establish a conversion factor between copies/mL and IU/mL [70].
- For qPCR: Prepare a standard curve using a minimum of 5 points, serially diluted (e.g., 1:10), that extends above and below the expected abundance of your target [71].
- Step 2: Run Setup. Include standards in every run. For dPCR, a minimum of 16 PCR replicates per reference material is recommended for verifying precision and accuracy [60].
- Step 3: Data Analysis.
- dPCR: Apply Poisson statistics to calculate the absolute concentration of the standard (copies/μL). Compare the measured value of the international standard to its assigned value to determine the conversion factor [70].
- qPCR: The software generates a standard curve from which the concentration of unknown samples is interpolated. Confirm the reaction efficiency is between 90–110% (slope between -3.6 and -3.1) [71].
- Step 4: Determining LOD and LOQ.
- Prepare a dilution series of the target nucleic acid, extending to concentrations near the expected detection limit.
- Test a high number of replicates (e.g., 20-50) at these low concentrations.
- The LOD is the lowest concentration at which ≥95% of replicates are positive.
- The LOQ is the lowest concentration at which the coefficient of variation (CV) for quantification is within an acceptable limit (e.g., <25-35%) and the measured concentration is within ±0.25 log of the expected value [70].
The following workflow diagram summarizes the parallel processes for dPCR and qPCR, highlighting the role of controls and standards.
Diagram 1: Comparative dPCR and qPCR Workflow with Integrated Controls. This diagram outlines the parallel processes for dPCR and qPCR analysis, highlighting the critical integration points for essential controls (NTCs and Standards) and the final validation stage.
Data Presentation and Analysis
Performance Metrics in Clinical Studies
Robust controls enable meaningful performance comparisons between dPCR and qPCR. The following table summarizes key findings from clinical studies detecting nucleic acids in liquid biopsies.
Table 2: Comparative Performance of dPCR and qPCR from Clinical Studies
| Application / Study | Technology | Key Performance Metric | Result | Citation |
|---|---|---|---|---|
| ctDNA in Rectal Cancer | ddPCR | Detection Rate (Baseline) | 58.5% (24/41) | [27] |
| NGS (qPCR-like) | Detection Rate (Baseline) | 36.6% (15/41) | [27] | |
| HDV RNA Quantification | RT-dPCR | Limit of Detection (LOD) | 0.56 IU/mL | [70] |
| RT-qPCR | Limit of Detection (LOD) | 14 IU/mL | [70] | |
| HDV RNA (Low Viremia) | RT-dPCR | Positive Detection (qPCR-negative samples) | 31% | [70] |
| HPV-associated Cancers (Meta-analysis) | NGS | Sensitivity (Pooled) | Highest | [7] |
| ddPCR | Sensitivity (Pooled) | Intermediate | [7] | |
| qPCR | Sensitivity (Pooled) | Lowest | [7] |
Control Acceptance Criteria
For an assay to be considered valid, its internal controls must meet predefined acceptance criteria.
Table 3: Acceptance Criteria for Essential Controls
| Control Type | Technology | Acceptance Criteria | Purpose |
|---|---|---|---|
| No Template Control (NTC) | dPCR | Zero (or negligible) positive droplets; no specific cluster in 2D plot. | Detect contamination. |
| qPCR | No amplification curve, or Cq value is undetermined (or exceeds a high threshold). | Detect contamination. | |
| Standard Curve / Linearity | qPCR | Reaction Efficiency: 90–110% (Slope: -3.6 to -3.1); R² > 0.98. | Validate quantification accuracy. |
| dPCR | Measured concentration of serially diluted standards is linear and accurate against expected values. | Validate system performance. | |
| Limit of Detection (LOD) | Both | ≥95% of replicates are positive at the LOD concentration. | Define lowest detectable level. |
The Scientist's Toolkit: Research Reagent Solutions
Successful implementation of controlled experiments relies on key reagents and materials.
Table 4: Essential Research Reagents and Materials
| Item | Function / Description | Example Application |
|---|---|---|
| Cell-Free DNA Blood Collection Tubes | Stabilizes blood cells and prevents genomic DNA release, preserving the integrity of plasma cfDNA. | Streck Cell-Free DNA BCT tubes used in ctDNA studies for baseline plasma collection [27]. |
| Nuclease-Free Water | A critical, uncontaminated solvent for resuspending primers, preparing reagents, and serving as the template in NTCs. | Used in No Template Controls (NTCs) to control for contamination [71]. |
| International Standard | A certified reference material with a defined unitage (e.g., IU) used to calibrate assays and ensure cross-lab comparability. | WHO International Standard for HDV RNA used to derive a conversion factor for RT-dPCR (0.77 copies/IU) [70]. |
| DNA Decontamination Solution | A chemical solution used to destroy contaminating DNA on laboratory surfaces and equipment. | Invitrogen DNAzap PCR DNA Degradation Solution used to prevent false positives [71]. |
| dPCR Master Mix | Optimized reaction mix containing polymerase, dNTPs, and buffers, specifically formulated for digital PCR partitioning. | One-Step RT-ddPCR Advanced kit for Probes used in HDV RNA quantification on Bio-Rad QX200 [70]. |
| Predesigned Assays | Optimized primer and probe sets for specific targets, often guaranteed to perform without the need for design and optimization. | Applied Biosystems TaqMan Assays for qPCR, which can include designs that span exon-exon junctions to avoid genomic DNA amplification [71] [72]. |
The rigorous application of No Template Controls and traceable Standards is non-negotiable in both dPCR and qPCR methodologies for ctDNA analysis. As evidenced by clinical studies, dPCR often demonstrates superior sensitivity for low-abundance targets, but its results, like those of qPCR, are only credible when underpinned by a robust framework of essential controls. By adhering to the detailed protocols and acceptance criteria outlined in this document, researchers and drug development professionals can generate reliable, reproducible, and clinically meaningful data, thereby advancing the field of liquid biopsy and personalized cancer therapy.
The reliability of circulating tumor DNA (ctDNA) analysis is fundamentally dependent on sample quality, with pre-analytical variables accounting for an estimated 50-75% of all laboratory errors [73] [74] [75]. For ctDNA detection—where target molecules can be present at frequencies below 0.1%—controlling these variables becomes particularly critical due to the low variant allele frequencies (often <1%) and short half-life of ctDNA (16 minutes to 2.5 hours) [76]. This application note provides detailed protocols for mitigating pre-analytical variables specifically within the context of comparative research on digital PCR (dPCR) versus quantitative PCR (qPCR) for ctDNA detection, enabling researchers to achieve more reliable and reproducible results.
Key Pre-Analytical Variables Affecting ctDNA Quality
Pre-analytical variables are traditionally categorized as biological (patient-related) or non-biological (sample-related). The tables below summarize the major factors impacting ctDNA analysis.
Table 1: Biological Variables Influencing ctDNA Analysis [73] [74]
| Variable Category | Specific Factor | Impact on ctDNA Analysis | Control Recommendations |
|---|---|---|---|
| Controllable | Recent Food Ingestion | Causes post-prandial lipemia, leading to spectral interference and potential false results in optical detection methods [73]. | Collect blood after a 12-hour fast; note non-fasting status if unavoidable [73] [74]. |
| Exercise | Increases enzyme levels (CK, AST, LDH) and may affect metabolism; physiological impact on ctDNA release is unclear [74]. | Draw blood prior to exercise and standardize patient rest periods [74]. | |
| Drugs & Supplements | Biotin (>5 mg/day) interferes with streptavidin-biotin based assays; other drugs may cause physiological or analytical interference [73]. | Document all medications/supplements; consult lab regarding biotin intake before phlebotomy [73]. | |
| Inherent | Tumor Type & Burden | ctDNA detection sensitivity varies by anatomic site (e.g., OPSCC > Cervical Cancer > SCCA) and cancer stage [44]. | Document cancer type and clinical stage; cannot be controlled. |
| Clonal Hematopoiesis (CHIP) | Somatic mutations from non-malignant blood cells cause false-positive results; frequency increases with age [76]. | Use matched white cell DNA for sequencing to identify CHIP variants; cannot be controlled [76]. |
Table 2: Non-Biological (Sample) Variables Influencing ctDNA Analysis [73] [74] [77]
| Process Stage | Variable | Impact on ctDNA Analysis | Control Recommendations |
|---|---|---|---|
| Sample Collection | Blood Collection Tube | Tube additives (e.g., EDTA, citrate, heparin) can inhibit PCR and affect downstream analysis [74]. | Use cell-free DNA BCT or K₂EDTA tubes; establish and adhere to a fixed hold time [77]. |
| Phlebotomy Technique | Hemolysis falsely increases potassium and enzymes; difficult draws can activate coagulation [73] [74]. | Train phlebotomists; avoid fist clenching; discard problematic draws [73]. | |
| Sample Handling & Transport | Time to Processing | Cellular metabolism consumes glucose; cells lyse in vitro, releasing genomic DNA and diluting the ctDNA fraction [74]. | Process plasma within 6 hours (K₂EDTA) or up to 3 days (cfDNA BCT); standardize across study [77]. |
| Temperature | Delay in separation and improper storage accelerates white cell lysis and nucleic acid degradation [74]. | Centrifuge at 4°C; store plasma at -80°C; avoid freeze-thaw cycles [74]. | |
| Plasma vs. Serum | The clotting process in serum samples traps a significant amount of ctDNA and releases genomic DNA from blood cells [77]. | Use plasma for ctDNA analysis to achieve higher yield and purity [77]. |
Comparative Technology Analysis: dPCR vs. qPCR in ctDNA Research
The choice between dPCR and qPCR significantly impacts the ability to manage and overcome pre-analytical challenges in ctDNA detection. The following table and workflow diagram compare their characteristics in this specific context.
Table 3: dPCR vs. qPCR for ctDNA Detection in the Context of Pre-Analytical Variables [44] [43] [76]
| Characteristic | Quantitative PCR (qPCR) | Digital PCR (dPCR) | Implication for ctDNA Analysis |
|---|---|---|---|
| Quantification Method | Relative (requires standard curve) | Absolute (no standard curve) | dPCR is superior for low-frequency variants and does not require reference standards, simplifying workflow. |
| Sensitivity (LoD) | Moderate (detects ~1% mutant allele) | High (detects ~0.1% mutant allele, down to 0.02% with BEAMing) [76] | dPCR is more suitable for early-stage cancer or minimal residual disease where ctDNA levels are minimal. |
| Tolerance to PCR Inhibitors | Lower (reaction occurs in a bulk volume) | Higher (sample partitioning dilutes inhibitors) [43] [9] | dPCR is more robust against common inhibitors from sample collection or DNA extraction. |
| Dynamic Range | Wide (up to 10 logs) | Narrower (limited by partition number) [9] [78] | qPCR is better for monitoring treatment response where ctDNA load may vary over several orders of magnitude. |
| Sample Throughput & Cost | High throughput, lower cost per sample | Lower throughput, higher cost per sample [9] | qPCR is more practical for high-volume screening; dPCR is ideal for low-frequency target confirmation. |
Figure 1: A workflow for ctDNA analysis integrating pre-analytical best practices and technology selection criteria. Adherence to standardized pre-analytical steps is critical for reliable downstream results with either qPCR or dPCR.
Detailed Experimental Protocols
Protocol: Plasma Processing for ctDNA Analysis from Whole Blood
This protocol is optimized to minimize cellular DNA contamination and ctDNA degradation [73] [74] [77].
Materials:
- Blood collected in K₂EDTA tubes or Cell-free DNA Blood Collection Tubes (cfDNA BCT)
- Refrigerated centrifuge
- Sterile pipettes and aerosol-resistant tips
- Nuclease-free microcentrifuge tubes
- Ice
Procedure:
- Inversion: Gently invert blood collection tubes 8-10 times immediately after draw.
- Initial Spin: Centrifuge tubes at 1600-2000 RCF for 10 minutes at 4°C to separate plasma from cells.
- Plasma Transfer: Carefully transfer the upper plasma layer to a new sterile tube using a pipette, avoiding the buffy coat (white cell layer).
- Second Spin: Centrifuge the transferred plasma at 16,000 RCF for 10 minutes at 4°C to remove any remaining cellular debris.
- Final Aliquot: Transfer the supernatant into nuclease-free tubes. If not extracting immediately, flash-freeze and store at -80°C.
Quality Control: Quantify the recovered plasma volume. A significant deviation from the expected 4-5 mL from a 10 mL draw may indicate a processing error.
Protocol: Assessment of Sample Quality and PCR Inhibition
This protocol uses a simple qPCR assay to detect cellular DNA contamination and PCR inhibitors, which is critical before performing rare mutation detection [77].
Materials:
- Extracted cfDNA sample
- qPCR Master Mix
- Primers targeting a multi-copy reference gene (e.g., RNase P) and a single-copy gene
- Real-time PCR instrument
Procedure:
- Assay Setup: Perform two qPCR reactions on the cfDNA sample:
- Reaction A: Targets a multi-copy reference gene.
- Reaction B: Targets a single-copy gene.
- Amplification: Run the qPCR with appropriate cycling conditions.
- Analysis:
- Compare the Ct values between the two assays. A lower-than-expected Ct for the single-copy gene relative to the multi-copy gene can indicate the presence of high molecular weight genomic DNA from cell lysis.
- Assess the amplification curve shape. A delayed Ct or abnormal curve shape suggests PCR inhibition.
Figure 2: A decision-tree workflow for cfDNA sample quality control prior to dPCR or qPCR analysis. This step is critical for validating pre-analytical processing.
The Scientist's Toolkit: Essential Research Reagent Solutions
Table 4: Key Reagents and Materials for Robust ctDNA Analysis [43] [76] [77]
| Item | Function | Considerations for Pre-Analytical Variables |
|---|---|---|
| Cell-Free DNA BCT | Blood collection tube with preservative to stabilize nucleated blood cells for up to 3 days at room temperature. | Critical for multi-center trials; prevents release of wild-type genomic DNA during transport, preserving the mutant allele frequency [77]. |
| Nucleic Acid Extraction Kits | Silica-membrane or magnetic bead-based isolation of cfDNA from plasma. | Choose kits validated for low-input, fragmented DNA. Manual column-based kits often show less sample loss than some automated systems for low-volume samples [77]. |
| dPCR/qPCR Master Mix | Optimized buffer, enzymes, and dNTPs for amplification. | dPCR master mixes are more tolerant to common PCR inhibitors (e.g., heparin, heme) due to sample partitioning, making them a robust choice for complex samples [43] [9]. |
| Fragmentation Analysis Assay | Bioanalyzer/TapeStation or qPCR assay to assess DNA fragment size distribution. | Quality control step to confirm the presence of the characteristic ~166 bp cfDNA peak and the absence of high molecular weight genomic DNA contamination [77]. |
| Reference DNA Panels | Commercially available DNA with known mutations at defined allele frequencies. | Essential as a positive control for assay validation and for monitoring inter-assay performance, helping to distinguish pre-analytical from analytical errors [76]. |
The detection and quantification of circulating tumor DNA (ctDNA) in liquid biopsies have emerged as powerful tools in oncology for disease monitoring, measurable residual disease (MRD) detection, and treatment response assessment [79]. Quantitative PCR (qPCR) and digital PCR (dPCR) are cornerstone technologies for this analysis, but their reliability is heavily dependent on experimental rigor. The Minimum Information for Publication of Quantitative Real-Time PCR Experiments (MIQE) and the digital MIQE (dMIQE) guidelines provide standardized frameworks to ensure the reproducibility, transparency, and credibility of results derived from these sensitive techniques [12] [80]. For researchers and drug development professionals working with ctDNA, adherence to these guidelines is not merely a publication formality but a fundamental requirement for generating clinically actionable data. This application note details the practical application of the MIQE and dMIQE guidelines in the context of ctDNA research, providing structured protocols, comparisons, and visualization to facilitate robust experimental design.
The MIQE and dMIQE Guidelines: Scope and Significance
Evolution and Rationale
The original MIQE guidelines were published in 2009 to address a widespread lack of consensus and transparency in how qPCR experiments were performed, documented, and interpreted [25]. Over the past 16 years, MIQE has become one of the most widely cited methodological publications in molecular biology, shaping best practices and informing journal editorial policies [12]. The recently published MIQE 2.0 guidelines [12] mark a critical milestone, building on the original document to account for technological advances and emerging applications. Concurrently, the dMIQE guidelines were established to address the specific requirements of digital PCR, a technology that allows the precise quantification of nucleic acids without the need for standard curves and is particularly suited for detecting rare variants and small fold-changes [80].
The core rationale behind these guidelines is simple but powerful: "no matter how powerful the technique, without methodological rigour, data cannot be trusted" [12]. This is especially critical in ctDNA analysis, where results can directly influence patient management decisions. Failures in documentation, assay validation, and data analysis can lead to exaggerated sensitivity claims and overinterpreted results, with real-world clinical consequences [12].
Key Areas Addressed by the Guidelines
The MIQE and dMIQE guidelines provide coherent, detailed guidance across the entire experimental workflow:
- Sample Quality and Handling: Documentation of sample provenance, storage conditions, and nucleic acid quality/quantity is required. For ctDNA from liquid biopsies, this includes details on plasma processing, cell-free DNA extraction, and quality assessment [12] [81].
- Assay Design and Validation: Guidelines mandate comprehensive information on assay sequences, specificity, and optimization data. For TaqMan assays, publication of the unique Assay ID and the amplicon context sequence is necessary for compliance [82].
- Experimental Protocol and Data Analysis: Reverse transcription protocols, PCR conditions, Cq determination methods, and PCR efficiency calculations must be fully disclosed. The guidelines also cover appropriate normalization strategies and statistical justification [12] [25].
- Reporting and Transparency: The purpose of the guidelines is to ensure that all relevant experimental conditions and assay characteristics are provided so reviewers can assess the validity of the protocols and other investigators can reproduce the results [25].
Table 1: Core Components of the MIQE and dMIQE Guidelines
| Component | MIQE (qPCR) | dMIQE (dPCR) |
|---|---|---|
| Primary Goal | Standardize reporting for quantitative real-time PCR | Standardize reporting for digital PCR experiments |
| Quantification Method | Relative or absolute quantification via standard curves | Absolute quantification without standard curves |
| Key Output | Cycle quantification (Cq) and amplification efficiency | Copy number or variant allele frequency (VAF) |
| Sample Quality Control | Mandatory RNA/DNA quality and quantity assessment | Mandatory RNA/DNA quality and quantity assessment |
| Assay Validation | Requires specificity, sensitivity, and PCR efficiency data | Requires specificity and sensitivity data |
| Data Transparency | Full disclosure of reagents, sequences, and analysis methods | Full disclosure of experimental protocols and analysis methods |
Experimental Design and Workflow for ctDNA Analysis
Adherence to MIQE guidelines begins at the earliest stages of experimental planning. The following workflow diagram outlines the critical stages for a ctDNA analysis project, from sample collection through data reporting, highlighting key decision points and quality control checkpoints mandated by the MIQE/dMIQE frameworks.
Figure 1. Experimental workflow for ctDNA analysis under MIQE/dMIQE guidelines. The process emphasizes quality control from sample collection to final reporting, ensuring data reliability.
Sample Procurement and Quality Control
The integrity of any ctDNA analysis is fundamentally dependent on pre-analytical conditions. Adherence to guidelines requires meticulous documentation.
- Sample Collection: Liquid biopsies, particularly blood plasma, are minimally invasive and provide systemic disease information [81]. Collect blood into appropriate stabilizing tubes to prevent genomic DNA contamination and preserve ctDNA integrity.
- Plasma Processing: Process samples within a defined timeframe (e.g., within 2 hours of collection) to prevent lysis of blood cells, which would dilute the ctDNA fraction. Use double centrifugation to ensure platelet-free plasma.
- cfDNA Extraction: Use validated kits for cell-free DNA extraction. Record the elution volume and the method used. The quantity and quality of extracted cfDNA should be assessed using a fluorescence-based method (e.g., Qubit) and fragment analysis (e.g., Bioanalyzer), as ctDNA typically fragments to ~170 bp [79].
- Quality Assessment: The MIQE guidelines stress that "Nucleic acid quality and integrity are not properly assessed" in many studies, which constitutes a fundamental methodological failure [12]. Report the DNA concentration and purity (A260/280 ratio), and provide a fragmentogram if available.
Assay Design and Validation
The design and validation of target-specific assays are critical for sensitive and specific ctDNA detection.
- Assay Design: For qPCR, design amplicons shorter than 100 bp to accommodate the fragmented nature of ctDNA. For dPCR, the same principle applies. BLAST the primer and probe sequences to ensure specificity. For known TaqMan assays, use the Assay ID and provide the amplicon context sequence to comply with MIQE guidelines [82].
- Assay Validation: Validate assay performance before analyzing patient samples.
- Efficiency: For qPCR, generate a standard curve with a minimum of 5 points (in triplicate) from a serially diluted template. The PCR efficiency (E) should be 90–110%, with a correlation coefficient (R²) >0.990 [25].
- Sensitivity and Specificity: Determine the limit of detection (LOD) and limit of quantification (LOQ). For dPCR, this involves testing dilution series to establish the lowest VAF that can be reliably detected, which can be as low as 0.02% for SNVs [79].
- Optimization: Optimize primer and probe concentrations to minimize Cq values and maximize signal-to-noise ratio.
Table 2: Key Reagent Solutions for ctDNA PCR Analysis
| Reagent / Material | Function | Guideline Compliance Consideration |
|---|---|---|
| Cell-free DNA Blood Collection Tubes | Stabilizes nucleated blood cells to preserve ctDNA profile | Document tube type and time-to-processing; critical for pre-analytical standardization. |
| cDNA Synthesis Kit | Reverse transcribes RNA into cDNA for RT-qPCR | Report manufacturer, catalog number, and reaction conditions including priming method [81]. |
| TaqMan Assays | Sequence-specific detection of targets via hydrolysis probes | Record the unique Assay ID and provide amplicon context sequence [82]. |
| dPCR Supermix | Enables partition generation and endpoint PCR for digital PCR | Specify manufacturer, catalog number, and reaction volume. |
| Reference Gene Assays | Used for normalization in qPCR to control for technical variation | Must validate gene stability for the specific sample type; failure is a common oversight [12]. |
Detailed Experimental Protocols
Protocol 1: MIQE-Compliant qPCR for Transcriptional Biomarkers
This protocol is adapted for analyzing gene expression levels of transcriptional biomarkers from liquid biopsies.
Materials:
- Extracted total RNA or cfRNA
- cDNA synthesis kit (e.g., High-Capacity cDNA Reverse Transcription Kit)
- TaqMan Gene Expression Assay (including primers and probe)
- TaqMan Universal PCR Master Mix
- Nuclease-free water
- qPCR instrument
Procedure:
- Reverse Transcription:
- Dilute RNA to a defined concentration (e.g., 100 ng/µL).
- Set up 20 µL reactions according to the kit protocol. Include a no-reverse transcriptase (NRT) control to detect genomic DNA contamination.
- Use a fixed priming method (e.g., oligo-dT or random hexamers) and document this choice.
qPCR Setup:
- Prepare a master mix for each TaqMan assay containing 10 µL of TaqMan Universal PCR Master Mix (2X), 1 µL of TaqMan Gene Expression Assay (20X), 4 µL of nuclease-free water, and 5 µL of cDNA template (diluted 1:10) per 20 µL reaction.
- Load each sample in triplicate technical replicates.
- Include a no-template control (NTC) for each assay to check for reagent contamination.
qPCR Run:
- Use the following standard cycling conditions on the qPCR instrument: 2 min at 50°C, 10 min at 95°C, followed by 40 cycles of 15 sec at 95°C and 1 min at 60°C.
Data Analysis:
- Set the Cq (quantification cycle) threshold manually in the linear phase of the amplification plots or use the instrument's automatic setting, but document the method.
- Calculate the PCR efficiency from a standard curve. Do not assume efficiency [12].
- Normalize data using a validated, stable reference gene. Perform stability analysis (e.g., using geNorm or BestKeeper) for the specific sample set [81]. Report the normalization method and the chosen reference gene(s).
Protocol 2: dMIQE-Compliant dPCR for ctDNA Variant Detection
This protocol is for the absolute quantification of a specific somatic mutation (SNV) in plasma cfDNA using probe-based dPCR, as exemplified in lymphoma monitoring [79].
Materials:
- Extracted cfDNA
- ddPCR Supermix for Probes (no dUTP)
- Target-specific dPCR assay (primers and FAM-labeled probe)
- Wild-type sequence dPCR assay (primers and HEX/VIC-labeled probe) for duplexing
- Droplet Generator
- Droplet Reader
- DG8 Cartridges and Gaskets
Procedure:
- Reaction Setup:
- Prepare a 20 µL reaction mix containing 10 µL of ddPCR Supermix, 1 µL of each assay (20X final concentration), and up to 20 ng of cfDNA. Adjust with nuclease-free water.
- Vortex and centrifuge the mixture briefly.
Droplet Generation:
- Load 20 µL of the reaction mix and 70 µL of Droplet Generation Oil into the respective wells of a DG8 cartridge.
- Place a gasket on the cartridge and load it into the Droplet Generator.
- Once droplet generation is complete, carefully transfer the emulsified sample (~40 µL) to a semi-skirted 96-well PCR plate. Seal the plate with a foil heat seal.
PCR Amplification:
- Place the sealed plate in a thermal cycler and run the following protocol: 10 min at 95°C; 40 cycles of 30 sec at 94°C and 1 min at 60°C (ramp rate 2°C/sec); followed by a 10 min hold at 98°C. Hold at 4°C.
Droplet Reading and Analysis:
- Place the PCR plate in the Droplet Reader.
- The instrument will automatically read the droplets from each well and quantify the fluorescence in each droplet (FAM and HEX).
- Analyze the data using the associated software. Set appropriate thresholds to distinguish positive and negative droplets for each channel.
- The software will calculate the concentration (copies/µL) of the mutant and wild-type alleles and the variant allele frequency (VAF) based on Poisson statistics.
Reporting:
- Report the number of accepted droplets, the concentration of the target, the VAF, and the confidence intervals (e.g., 95% CI). For the study on lymphoma, a detection sensitivity of 0.02% for SNVs was achieved [79]. Document the LOD/LOQ established during assay validation.
Comparison of qPCR and dPCR for ctDNA Applications
The choice between qPCR and dPCR depends on the specific research question, required sensitivity, and available resources. The following diagram illustrates the decision-making pathway for selecting the appropriate technology based on experimental goals.
Figure 2. Technology selection guide for ctDNA analysis. dPCR is favored for absolute quantification of rare variants without standard curves, while qPCR remains suitable for relative quantification.
Table 3: qPCR vs. dPCR for ctDNA Analysis: A Guideline-Based Comparison
| Parameter | qPCR (MIQE) | dPCR (dMIQE) |
|---|---|---|
| Primary Application in ctDNA | Relative gene expression; detection of highly abundant mutations | Absolute quantification; detection of rare mutations (MRD); copy number variation |
| Quantification Basis | Relative to standard curve or reference genes | Absolute count by Poisson statistics |
| Sensitivity (Typical VAF) | ~1–5% | ~0.01–0.1% [79] |
| Precision | Lower, dependent on standard curve | High, especially at low target concentrations |
| Susceptibility to Inhibition | More susceptible; affects Cq values | Less susceptible; impacts positive/negative droplet count but not concentration [80] |
| Throughput | High | Moderate to High |
| Cost per Sample | Lower | Higher |
| Guideline Mandates | PCR efficiency, Cq threshold, normalization | Number of partitions, threshold setting, confidence intervals |
Implementing Guidelines in Practice: A Case Study in Lymphoma
A 2023 proof-of-concept study on B-cell lymphomas provides an exemplary model of MIQE/dMIQE principles applied to ctDNA-based disease monitoring [79]. The researchers performed 30X whole-genome sequencing (WGS) on diagnostic tumor tissue to identify patient-specific structural variants and single nucleotide variants. This comprehensive profiling informed the design of ultra-sensitive, patient-specific multiplex ddPCR assays.
Key implementation steps included:
- Multi-targeted Approach: Assays were designed to simultaneously detect multiple SNVs, indels, and SVs, enhancing the sensitivity and robustness of MRD detection.
- Exceptional Sensitivity: The validated assays achieved a detection sensitivity of 0.0025% for SV assays and 0.02% for SNVs/indel assays, far exceeding typical qPCR capabilities [79].
- Clinical Correlation: Longitudinal ctDNA analysis demonstrated that clearance of ctDNA correlated with positive PET-CT imaging response. Critically, in one patient, ctDNA was detected in a follow-up sample 25 weeks before the clinical manifestation of relapse, highlighting the potential of guideline-compliant methods for early intervention.
This case study underscores how adherence to rigorous methodological standards—comprehensive assay design, thorough validation, and transparent reporting—enables the generation of reliable, clinically significant data.
The MIQE and dMIQE guidelines are not bureaucratic obstacles but foundational frameworks that empower robust science. For researchers and drug development professionals focused on ctDNA, strict adherence to these guidelines is paramount. It ensures that data on transcriptional biomarkers, variant allele frequencies, and MRD are not only publishable but are also robust, reproducible, and reliable [12]. As the field of liquid biopsies continues to evolve and integrate into clinical decision-making, the collective will to implement these guidelines will be a major determinant of progress. By treating PCR not as a "black box" but as a technique demanding transparency and rigor, the scientific community can fully leverage its power to advance personalized medicine and improve patient outcomes.
Head-to-Head Comparison: Validating Performance in Clinical Research
In circulating tumor DNA (ctDNA) research, the selection of a detection platform is pivotal for achieving accurate and reliable molecular data. The analysis of ctDNA, a fraction of the total cell-free DNA (cfDNA) that can sometimes constitute less than 0.01% of the total, presents a significant technical challenge, demanding methodologies of the highest sensitivity and precision [83]. This application note provides a direct, data-driven comparison of the performance metrics of Quantitative Real-Time PCR (qPCR) and Digital PCR (dPCR) within this context. We focus on the core performance parameters of sensitivity, specificity, and precision, underpinned by quantitative data from recent studies and detailed experimental protocols to guide researchers and drug development professionals in their platform selection for ctDNA-based applications.
Comparative Performance Metrics: dPCR vs. qPCR
The fundamental differences in the mechanics of qPCR and dPCR translate directly into divergent performance outcomes, particularly when dealing with the low-abundance targets characteristic of ctDNA analyses. The following tables summarize key comparative data.
Table 1: Direct Comparison of Analytical Performance Metrics
| Performance Metric | Quantitative Real-Time PCR (qPCR) | Digital PCR (dPCR) |
|---|---|---|
| Quantification Method | Relative (requires standard curve) [43] | Absolute (no standard curve required) [43] [84] |
| Sensitivity (Mutation Detection) | >1% mutant allele frequency [43] | ≥ 0.1% mutant allele frequency [43] |
| Precision (Variability) | Higher intra-assay variability (e.g., median CV% reported as higher than 4.5%) [6] | Lower intra-assay variability (e.g., median CV%: 4.5%) [6] |
| Tolerance to PCR Inhibitors | Prone to inhibitors [43] | Higher tolerance / Increased robustness [43] [84] |
| Dynamic Range | Broad dynamic range [43] | Higher precision for fractional abundance analysis [43] |
Table 2: Performance in Applied ctDNA Detection Studies
| Application / Study | qPCR Performance | dPCR Performance |
|---|---|---|
| Periodontal Pathobionts (Bacterial Load) | False negatives and a 5-fold underestimation of prevalence at low concentrations (< 3 log10 Geq/mL) [6] | Superior sensitivity, detecting lower bacterial loads; high concordance with qPCR only at medium/high loads [6] |
| SARS-CoV-2 Viral RNA Detection | Sensitivity is lower compared to ddPCR, leading to potential false negatives [37] | Equal or superior sensitivity to RT-qPCR; more suitable for determining absolute copy number of reference materials [37] |
| FCGR3B Copy Number Variation | Reliable for estimating copy numbers (0 to 4) with results in full concordance with dPCR platforms [85] | Full concordance with qPCR results; offers advantages but not strictly necessary for this specific CNV assay [85] |
Experimental Protocols for ctDNA Analysis
The following protocols detail standardized methodologies for detecting ctDNA using droplet digital PCR, as employed in recent oncological studies.
Protocol: Urine ctDNA Detection for HCC via ddPCR
This protocol is adapted from a study detecting urine ctDNA to predict hepatocellular carcinoma (HCC) recurrence [86].
1. Sample Collection and Preparation:
- Collect at least 50 mL of midstream urine in the morning.
- Process within 2 hours of collection.
- Centrifuge at 15,000 × g for 15 minutes to remove debris and cellular contaminants.
- Recover a minimum of 5 mL of supernatant.
2. cfDNA Extraction:
- Purify and extract urine cfDNA using the QIAamp Circulating Nucleic Acid Kit and the QIAvac 24 Plus vacuum manifold, following the manufacturer's instructions.
3. ddPCR Reaction Setup:
- Prepare a 20 µL reaction mixture containing:
- 10 µL of 2× ddPCR SuperMix
- 5 µL of extracted cfDNA template
- 1 µL of 20× wild-type probe/primer mix
- 1 µL of 20× mutant probe/primer mix
- Nuclease-free water to volume.
- Target Mutations: This protocol targeted hotspots in TP53 (c.747G>T), TERT (c.1-124C>T), and CTNNB1 (c.121A>G, c.133T>C).
- Prepare a 20 µL reaction mixture containing:
4. Droplet Generation and Thermocycling:
- Generate droplets using the QX200 Droplet Generator.
- Transfer the emulsified samples to a 96-well PCR plate.
- Seal the plate and perform PCR amplification on a thermal cycler.
- Standard Thermocycling Conditions:
- 95°C for 10 minutes (enzyme activation)
- 40 cycles of:
- 94°C for 30 seconds (denaturation)
- 55-60°C for 60 seconds (annealing/extension; optimize temperature for assay)
- 98°C for 10 minutes (enzyme deactivation)
- 4°C hold.
5. Droplet Reading and Data Analysis:
- Read the plate on the QX200 Droplet Reader.
- Analyze the data using the manufacturer's software (e.g., QuantaSoft).
- The mutant allele frequency (MAF) is calculated automatically by the software based on the Poisson distribution.
Protocol: Multiplexed Detection of Periodontal Pathobionts via Nanoplate dPCR
This protocol demonstrates a multiplexed dPCR assay on the QIAcuity platform, relevant for complex sample analysis [6].
1. DNA Extraction:
- Extract DNA from subgingival plaque or other samples using the QIAamp DNA Mini kit, following the manufacturer's instructions.
2. dPCR Master Mix Preparation:
- Prepare a 40 µL reaction mixture on a pre-plate containing:
- 10 µL of sample DNA.
- 10 µL of 4× Probe PCR Master Mix.
- 0.4 µM of each specific primer.
- 0.2 µM of each specific hydrolysis probe (FAM, HEX/VIC, etc.).
- 0.025 U/µL of a restriction enzyme (e.g., Anza 52 PvuII) to reduce background.
- Nuclease-free water to volume.
- Prepare a 40 µL reaction mixture on a pre-plate containing:
3. Nanoplate Loading and Partitioning:
- Transfer the reaction mixture to a QIAcuity Nanoplate 26k.
- Seal the nanoplate with the appropriate foil seal.
- Load the plate into the QIAcuity instrument. The instrument automatically performs partitioning of each well into ~26,000 partitions.
4. Thermocycling and Imaging:
- The instrument runs the following integrated program:
- Initial activation: 2 minutes at 95°C.
- 45 amplification cycles: 15 seconds at 95°C, 1 minute at 58°C.
- Endpoint imaging: The instrument images each partition on multiple channels (e.g., green, yellow, crimson) to detect positive signals for each target.
- The instrument runs the following integrated program:
5. Data Analysis:
- Analyze data using the QIAcuity Software Suite.
- DNA concentrations are automatically calculated based on the Poisson distribution. Apply a Volume Precision Factor if available for improved accuracy.
- A reaction is typically considered positive if at least three partitions are positive.
The Scientist's Toolkit: Essential Research Reagent Solutions
Table 3: Key Reagents and Kits for dPCR-based ctDNA Analysis
| Item | Function / Application | Example Product(s) |
|---|---|---|
| Circulating Nucleic Acid Kit | Optimized for purification of low-abundance cfDNA/ctDNA from plasma or urine. | QIAamp Circulating Nucleic Acid Kit [86] |
| dPCR Supermix | Provides the core reagents (polymerase, dNTPs, buffer) for the digital PCR reaction. | ddPCR Supermix [87] [86], QIAcuity Probe PCR Kit [6] |
| Hydrolysis Probes | Sequence-specific probes (e.g., TaqMan) labeled with a fluorophore and quencher for target detection and quantification. | Dual-Labeled Probes [87] |
| Restriction Enzyme | Used in some dPCR protocols to digest high-molecular-weight DNA, reduce background, and improve partitioning efficiency. | Anza 52 PvuII [6] |
| Partitioning Consumables | Platform-specific cartridges, nanoplates, or reagents used to create the thousands of individual partitions. | 8-chamber cartridges & DG oil [87], QIAcuity Nanoplate 26k [6] |
Workflow and Pathway Diagrams
The following diagrams illustrate the core procedural and logical pathways described in this application note.
dPCR Workflow Diagram
dPCR Workflow
ctDNA Detection Logic
ctDNA Detection Path
The detection of rare mutations and low-abundance nucleic acid targets represents a significant challenge in molecular biology, with profound implications for areas such as cancer research, pathogen detection, and non-invasive prenatal testing. In circulating tumor DNA (ctDNA) research, this challenge is particularly acute; tumor-derived DNA fragments often constitute less than 0.1% of the total cell-free DNA in circulation, necessitating detection technologies of exceptional sensitivity and specificity [88] [1]. The clinical utility of detecting these minute signals is substantial, enabling early cancer detection, treatment response monitoring, and minimal residual disease assessment [1] [3].
This application note provides a detailed comparative analysis of two pivotal technologies—digital PCR (dPCR) and quantitative real-time PCR (qPCR)—in the context of detecting rare mutations and low-abundance targets. We present quantitative performance data, detailed experimental protocols for both technologies, and a curated list of essential research reagents to empower researchers in selecting and implementing the optimal methodological approach for their specific application needs.
Performance Comparison: dPCR vs. qPCR
The fundamental differences in the principles of dPCR and qPCR translate into distinct performance characteristics, especially for challenging applications like ctDNA analysis.
Comparative Analytical Performance
The following table summarizes key performance metrics for dPCR and qPCR based on recent comparative studies.
Table 1: Analytical performance comparison of dPCR versus qPCR
| Performance Metric | Digital PCR (dPCR) | Quantitative Real-Time PCR (qPCR) |
|---|---|---|
| Quantification Method | Absolute, without a standard curve [43] [29] | Relative, requires a standard curve [43] [29] |
| Precision (Intra-assay Variability) | Superior (Median CV%: 4.5%) [6] | Lower (significantly higher than dPCR) [6] |
| Sensitivity for Low Abundance | Superior; detects targets at <0.1% variant allele frequency [43] [89] | Limited; typically detects mutations at >1% variant allele frequency [43] |
| Tolerance to PCR Inhibitors | High [43] [89] | Moderate to Low [43] |
| Dynamic Range | Linear over a wide range [6] | Broad, but reliant on standard curve quality [43] |
| Multiplexing Capability | High, suitable for complex mixtures [6] [89] | Established, but can be impacted by competition between targets [6] |
Application-Specific Performance
A meta-analysis focusing on circulating tumor HPV DNA (ctHPVDNA) detection demonstrated that the sensitivity of different platforms varies significantly. The analysis found that next-generation sequencing (NGS) offered the greatest sensitivity, followed by droplet digital PCR (ddPCR), and then qPCR. This confirms dPCR's superior performance over qPCR for detecting low-abundance targets in a complex background [7]. Furthermore, a 2025 study on periodontal pathobionts highlighted dPCR's superior sensitivity in a microbial context, where it detected bacterial loads that resulted in false negatives with qPCR, effectively demonstrating a 5-fold higher prevalence for some targets [6].
Experimental Protocols
The following sections provide detailed methodologies for detecting a low-abundance KRAS G12D mutation in plasma-derived ctDNA using both dPCR and qPCR.
Digital PCR Protocol for Rare Mutation Detection
This protocol is adapted for a nanoplate-based dPCR system (e.g., QIAcuity, Qiagen) [6] [89].
Table 2: Key research reagents for dPCR
| Reagent/Material | Function | Example Product/Note |
|---|---|---|
| DNA Extraction Kit | Isolation of cell-free DNA from plasma | QIAamp Circulating Nucleic Acid Kit (Qiagen) [88] |
| Multiplex dPCR Master Mix | Provides core components for PCR | QIAcuity Probe PCR Kit (Qiagen) [6] |
| Mutation-Specific Assay | Detects the KRAS G12D mutation | TaqMan SNP Genotyping Assay |
| Reference Assay | Detects a wild-type sequence for normalization | TaqMan Copy Number Reference Assay |
| Restriction Enzyme | Digests genomic DNA to reduce background | Anza 52 PvuII (Thermo Scientific) [6] |
| dPCR Nanoplate | Platform for partition generation | QIAcuity Nanoplate 26k/96k (Qiagen) |
Procedure:
- cfDNA Extraction: Extract cfDNA from 2-4 mL of patient plasma using a dedicated circulating nucleic acid kit according to the manufacturer's instructions. Elute DNA in a low volume (e.g., 20-50 µL) of nuclease-free water [88].
- Reaction Mixture Preparation: In a pre-plate, prepare a 40 µL reaction mixture containing:
- 10 µL of extracted cfDNA.
- 10 µL of 4× Probe PCR Master Mix.
- 0.4 µM each of forward and reverse primers for the KRAS G12D assay and the reference assay.
- 0.2 µM each of the corresponding FAM and VIC-labeled probes.
- 0.025 U/µL of the restriction enzyme Anza 52 PvuII.
- Nuclease-free water to 40 µL.
- Partitioning and Loading: Transfer the reaction mixture to a dPCR nanoplate. Seal the plate and load it into the dPCR instrument.
- Thermal Cycling: Run the following thermocycling protocol:
- Enzyme activation: 2 minutes at 95°C.
- 45 cycles of:
- Denaturation: 15 seconds at 95°C.
- Annealing/Extension: 1 minute at 58°C [6].
- Endpoint Imaging and Analysis: The instrument will perform endpoint fluorescence imaging of all partitions. Use the instrument's software suite to analyze the data. The concentration of the mutant and wild-type targets (in copies/µL) will be calculated automatically based on the fraction of positive partitions using Poisson statistics [89].
dPCR Workflow: Partitioning enables absolute quantification.
Quantitative Real-Time PCR Protocol
This protocol describes a matched, tumor-informed qPCR approach for detecting the same KRAS G12D mutation, which is critical for achieving the best possible sensitivity with this technology [1].
Table 3: Key research reagents for qPCR
| Reagent/Material | Function | Example Product/Note |
|---|---|---|
| DNA Extraction Kit | Isolation of cell-free DNA from plasma | QIAamp Circulating Nucleic Acid Kit (Qiagen) [88] |
| qPCR Master Mix | Core components for probe-based qPCR | TaqMan Universal PCR Master Mix |
| Mutation-Specific Assay | Detects the KRAS G12D mutation | TaqMan SNP Genotyping Assay |
| Standard Curve Material | Contains known copies of mutant target; essential for quantification | Synthetic gBlock or plasmid DNA |
Procedure:
- cfDNA Extraction and Sample Preparation: Follow the same extraction protocol as in the dPCR method.
- Standard Curve Preparation: Serially dilute a synthetic standard containing the KRAS G12D mutation in a background of wild-type DNA to create a standard curve spanning at least 5 orders of magnitude (e.g., from 10^5 to 10^1 copies per reaction).
- Reaction Mixture Preparation: For each sample and standard, prepare a 20 µL reaction mixture containing:
- 5 µL of cfDNA or standard.
- 10 µL of 2× TaqMan Universal PCR Master Mix.
- 1 µL of 20× KRAS G12D TaqMan Assay.
- 4 µL of nuclease-free water.
- Thermal Cycling and Data Acquisition: Run the reaction in a real-time PCR instrument using the following standard conditions:
- Enzyme activation: 2 minutes at 50°C (UDG incubation, if applicable).
- Polymerase activation: 10 minutes at 95°C.
- 45 cycles of:
- Denaturation: 15 seconds at 95°C.
- Annealing/Extension: 1 minute at 60°C. Fluorescence data (FAM channel) is collected at the end of each annealing/extension step.
- Data Analysis:
- The instrument's software will generate a standard curve by plotting the Cycle Threshold (Ct) values of the standards against the logarithm of their known concentrations.
- The concentration of the KRAS G12D mutation in unknown samples is determined by interpolating their Ct values against this standard curve.
qPCR Workflow: Relies on a standard curve for relative quantification.
The Scientist's Toolkit: Essential Research Reagent Solutions
Successful detection of low-abundance targets requires careful selection of reagents and materials at every step, from sample collection to data analysis.
Table 4: Essential materials and reagents for sensitive ctDNA analysis
| Category | Item | Critical Function |
|---|---|---|
| Sample Collection & Stabilization | Cell-Free DNA Blood Collection Tubes (e.g., Streck, PAXgene) | Preserves blood sample integrity, prevents genomic DNA contamination from white blood cell lysis during transport [88]. |
| Nucleic Acid Extraction | Silica Membrane-based cfDNA Kits (e.g., QIAamp Circulating Nucleic Acid Kit) | Efficiently recovers short, fragmented ctDNA from large plasma volumes [88]. |
| Assay Design | Hydrolysis Probes (TaqMan) | Provide high specificity essential for discriminating single-nucleotide variants in a wild-type background [6] [29]. |
| PCR Enzymes & Master Mixes | Digital PCR Master Mix (e.g., QIAcuity Probe PCR Kit) | Optimized for partition-based quantification and robust amplification [6]. |
| PCR Platforms | Nanoplate dPCR Systems (e.g., QIAcuity) | Offer a streamlined, automated workflow with high partition numbers for precise quantification [43] [89]. |
The direct comparison of performance metrics and workflows clearly demonstrates that digital PCR outperforms qPCR for applications requiring the detection of rare mutations and low-abundance targets. dPCR's principal advantages of absolute quantification without standard curves, superior sensitivity and precision, and enhanced resilience to PCR inhibitors make it the technology of choice for critical applications in liquid biopsy, such as monitoring minimal residual disease and tracking therapeutic resistance [6] [1].
While qPCR remains a powerful, high-throughput, and cost-effective tool for many routine molecular diagnostics, the emergence of dPCR has fundamentally expanded the boundaries of what is detectable. Researchers and clinicians can leverage dPCR to uncover biologically significant, low-level nucleic acid signals that were previously obscured, thereby advancing the frontiers of precision medicine.
In the field of molecular diagnostics and oncology research, particularly in the detection and monitoring of circulating tumor DNA (ctDNA), the choice of quantification method is paramount. The central dichotomy lies between established relative quantification methods, which rely on standard curves, and emerging absolute quantification techniques that employ direct molecule counting [19] [67]. Quantitative PCR (qPCR) using standard curves has long been the gold standard for nucleic acid quantification. However, Digital PCR (dPCR), which enables absolute quantification through direct molecule counting without the need for standard curves, is increasingly recognized for its superior precision and sensitivity in challenging applications like ctDNA analysis [44] [43]. This application note details the technical principles, comparative performance, and practical protocols for these two approaches, providing a framework for researchers to select the optimal method for ctDNA detection in drug development and clinical research.
Fundamental Principles of Quantification
Relative Quantification via Standard Curves (qPCR)
In qPCR, quantification is relative and based on the principle that the cycle at which amplification is first detected (the Cycle threshold, Ct) is proportional to the starting quantity of the target nucleic acid. A standard curve is constructed by plotting the Ct values of known template concentrations across a dilution series. The concentration of an unknown sample is then determined by comparing its Ct value to this curve [19]. This method is inherently relative, as the accuracy of the result depends entirely on the accuracy and integrity of the standard curve. Key considerations include the requirement for precise pipetting for serial dilutions and the use of pure, accurately quantified standard materials to avoid inflation of copy number estimates [19].
Absolute Quantification via Direct Molecule Counting (dPCR)
Digital PCR takes a fundamentally different approach. The sample is partitioned into thousands to millions of individual reactions, such that some partitions contain one or more target molecules and others contain none. Following end-point PCR amplification, the number of positive and negative partitions is counted. The absolute concentration of the target molecule is then calculated directly using Poisson statistics to account for partitions containing more than one molecule, a method known as direct molecule counting [19] [67]. This process eliminates the need for a standard curve and an external calibrator, providing an absolute count of target molecules per input volume [43].
Figure 1: The dPCR workflow for absolute quantification. The sample is partitioned, amplified, and analyzed via direct counting and Poisson statistics to determine the absolute target concentration, eliminating the need for a standard curve.
Comparative Performance Data
The theoretical advantages of dPCR translate into measurable performance differences in practice, especially for ctDNA analysis. The tables below summarize key comparative data.
Table 1: Quantitative comparison of qPCR and dPCR performance characteristics based on empirical studies.
| Performance Metric | qPCR (Standard Curve) | dPCR (Direct Counting) | References & Notes |
|---|---|---|---|
| Sensitivity (Pooled) | 0.51 (95% CI: 0.37–0.64) | 0.81 (95% CI: 0.73–0.87) | For ctHPVDNA detection; 19 ddPCR vs. 11 qPCR studies [44] |
| Precision (CV) | 5.0% | 2.3% | Measurement of human genomic DNA (175 cp/µL) [90] |
| Tolerance to Inhibitors | Lower; amplification efficiency affected | Higher; robust due to sample partitioning [43] | |
| Dynamic Range | ~7 orders of magnitude [91] | Up to 6 orders of magnitude (platform-dependent) [91] | |
| Mutation Detection | >1% | ≥ 0.1% [43] |
Table 2: Sensitivity of different detection platforms for ctHPVDNA in a 2024 meta-analysis [44].
| Detection Platform | Pooled Sensitivity | Statistical Significance |
|---|---|---|
| Next-Generation Sequencing (NGS) | 0.94 (95% CI: 0.88–0.97) | NGS > ddPCR (P = 0.014) |
| Droplet Digital PCR (ddPCR) | 0.81 (95% CI: 0.73–0.87) | ddPCR > qPCR (P < 0.001) |
| Quantitative PCR (qPCR) | 0.51 (95% CI: 0.37–0.64) | Reference |
Application in ctDNA Research: Protocol for ctHPVDNA Detection
The following protocol is adapted from methodologies used in recent meta-analyses and performance studies for the detection of circulating tumor HPV DNA (ctHPVDNA), a key biomarker in oropharyngeal and other HPV-associated cancers [44].
Sample Collection and Preparation
- Sample Type: Collect whole blood into EDTA or cell-free DNA BCT tubes.
- Plasma Isolation: Centrifuge blood within 2 hours of collection at 800–1600 × g for 10–20 minutes at 4°C. Transfer the plasma supernatant to a new tube and perform a second high-speed centrifugation (16,000 × g for 10 minutes) to remove residual cells.
- Cell-Free DNA (cfDNA) Extraction: Use commercially available cfDNA extraction kits (e.g., MagMax Viral/Pathogen kit) on automated systems like the KingFisher Flex [14]. Elute cfDNA in a low TE buffer or nuclease-free water.
- Storage: Store plasma at -80°C if not processed immediately. Store extracted cfDNA at -20°C or -80°C.
Assay Design
- qPCR Assay: Design TaqMan probe-based assays targeting specific HPV genes (e.g., E6, E7). A standard curve must be generated using a serially diluted plasmid DNA or synthetic oligonucleotide of known concentration containing the target sequence [19].
- dPCR Assay: Use the same primer-probe sets as for qPCR to ensure comparability. However, no standard curve is needed. The assay must be optimized for the specific dPCR platform (e.g., droplet-based or nanowell-based) to ensure optimal partitioning and amplification [43] [14].
Experimental Workflow
Figure 2: A side-by-side comparison of the qPCR (relative) and dPCR (absolute) quantification workflows.
Quantification and Data Analysis
qPCR Analysis:
- The software generates a standard curve from the known standards. The curve's efficiency should be between 90–110%, with an R² value ≥0.990 [90].
- The concentration of the unknown ctHPVDNA sample is determined by interpolating its Ct value from the standard curve.
- Results are typically expressed as copies per microliter of eluate or milliliter of plasma, recognizing this is a relative estimate based on the curve.
dPCR Analysis:
- The platform's software automatically identifies positive and negative partitions based on fluorescence amplitude.
- The absolute concentration of the target (in copies per microliter of input reaction mix) is calculated directly by the software using Poisson modeling [19] [43].
- No reference curve is involved, making the result an absolute count.
The Scientist's Toolkit: Essential Research Reagent Solutions
Table 3: Key reagents and materials for ctDNA detection experiments.
| Item | Function/Description | Example Products/Targets |
|---|---|---|
| cfDNA Extraction Kits | Isolation of high-quality, non-degraded cfDNA from plasma samples. Critical for yield and assay accuracy. | MagMax Viral/Pathogen Kit; STARMag 96 X 4 Universal Cartridge Kit [14] |
| PCR Master Mix | Provides optimized buffer, enzymes, and dNTPs for efficient and specific amplification. | TaqMan Genotyping Mastermix; ddPCR Supermix [91] |
| Assay Primers & Probes | Target-specific oligonucleotides for amplification and detection. Hydrolysis (TaqMan) probes are standard. | Custom designs for HPV E6/E7, KRAS G12/13 mutants, EGFR T790M, etc. [44] [91] |
| Absolute Quantification Standards | Known-concentration materials for validating dPCR accuracy or generating qPCR standard curves. | Plasmid DNA, gBlocks, or commercially available quantitative standards [19] |
| Partitioning Oil/Stabilizer | (For droplet-based dPCR) Generates stable, monodisperse droplets for partitioning. | RainDrop Stabilizer; ddPCR Droplet Generation Oil [91] |
| Internal Positive Controls | Controls for detecting PCR inhibition and verifying reaction efficiency, especially in qPCR. | Assays for endogenous genes (e.g., RNase P) or spiked-in synthetic templates [14] |
The choice between standard curve-based quantification and direct molecule counting is application-dependent. For qPCR, the primary advantages are a wider dynamic range, established and familiar protocols, and lower cost per sample [91]. Its main limitations are the reliance on external standards, which introduces potential for error, lower precision, and reduced sensitivity for detecting rare events or small fold-changes [44] [43].
dPCR offers superior precision, absolute quantification without standards, higher tolerance to inhibitors, and exceptional sensitivity for rare allele detection [43] [90]. These attributes make it particularly suited for ctDNA analysis, where detecting low-frequency mutations against a high background of wild-type DNA is a major challenge [44]. The main constraints of dPCR are a narrower dynamic range on some platforms, higher initial costs, and the need for specialized instrumentation [91] [78].
For ctDNA detection in drug development, where accurately quantifying minute changes in tumor-derived DNA is critical for monitoring treatment response and residual disease, dPCR presents a compelling advantage. The 2024 meta-analysis confirms that dPCR offers significantly higher sensitivity for ctDNA detection than qPCR, a critical factor for early intervention and therapy personalization [44]. As the field moves towards more liquid biopsy applications, dPCR and its successors, which aim to overcome current limitations like dynamic range and reliance on Poisson statistics, are poised to become the new benchmarks for precise molecular quantification in oncology research [78].
Throughput and Cost-Benefit Analysis for the Modern Lab
The selection of an appropriate molecular diagnostic platform is a critical decision for modern laboratories engaged in circulating tumor DNA (ctDNA) research. This application note provides a comprehensive throughput and cost-benefit analysis of digital PCR (dPCR) and quantitative PCR (qPCR) technologies within the context of ctDNA detection. As liquid biopsies become increasingly integrated into cancer management, researchers and drug development professionals require clear guidance on platform selection based on analytical performance, operational efficiency, and economic feasibility [1]. We present structured experimental data, detailed protocols, and analytical frameworks to support informed decision-making for clinical research and therapeutic development.
Technology Comparison: Performance and Economic Metrics
Analytical Performance and Operational Characteristics
The fundamental differences between qPCR and dPCR technologies directly influence their application suitability for ctDNA analysis. qPCR provides relative quantification through cycle threshold (Ct) values measured during exponential amplification phases, while dPCR achieves absolute quantification by partitioning samples into thousands of individual reactions and counting positive endpoints using Poisson statistics [67] [43].
Table 1: Key Performance Characteristics of qPCR vs. dPCR for ctDNA Analysis
| Characteristic | Quantitative PCR (qPCR) | Digital PCR (dPCR) |
|---|---|---|
| Quantification Approach | Relative (requires standard curve) | Absolute (no standard required) |
| Detection Sensitivity | Mutation rate >1% [43] | Mutation rate ≥0.1% [43] |
| Precision | Moderate | High (subject to Poisson statistics) [43] |
| Tolerance to PCR Inhibitors | Moderate | High (due to sample partitioning) [43] |
| Multiplexing Capability | Well-established | Developing |
| Throughput | High (96- or 384-well formats) | Moderate (depending on platform) |
| Hands-on Time | Lower | Moderate to High |
| Cost per Sample | Lower [27] | Higher (5–8.5× compared to NGS) [27] |
For ctDNA applications, where detecting rare mutations against a background of wild-type DNA is critical, dPCR's superior sensitivity and tolerance to PCR inhibitors provide significant advantages [43]. This technological difference translates directly to application-specific performance, particularly in minimal residual disease (MRD) monitoring and early treatment response assessment where ctDNA concentrations can be extremely low [1].
Throughput and Economic Considerations
Throughput capabilities and cost structures vary substantially between qPCR and dPCR platforms, impacting their suitability for different laboratory workflows.
Table 2: Throughput and Economic Comparison for ctDNA Workflows
| Parameter | Quantitative PCR (qPCR) | Digital PCR (dPCR) |
|---|---|---|
| Theoretical Market Size (2025) | Part of combined $1395.1M dPCR/qPCR market [92] | Part of combined $1395.1M dPCR/qPCR market [92] |
| Instrument Cost | Lower | Higher (traditional systems) |
| Cost per Sample | $0.2–$2 (routine testing) [9] | Higher (reagents and consumables) |
| Sample Partitioning | Not applicable | Thousands to millions of partitions [67] |
| Automation Capability | High | Platform-dependent |
| Result Interpretation | Standard curves required | Direct absolute quantification |
| Best Application Fit | High-throughput screening, gene expression | Low-abundance mutation detection, copy number variation |
The economic analysis must account for both initial capital investment and ongoing consumable costs. While dPCR systems traditionally required significant investment, recent developments in nanoplate-based dPCR technologies have improved throughput and reduced operational complexity [43]. Some integrated systems can now process results in under two hours, approaching the throughput of traditional qPCR systems while maintaining the precision advantages of digital quantification [43].
Application-Specific Performance in ctDNA Detection
Sensitivity and Specificity in Cancer Monitoring
Recent meta-analyses directly comparing detection methods for circulating tumor HPV DNA (ctHPVDNA) demonstrate clear sensitivity differences between platforms. In one comprehensive analysis, NGS showed the highest sensitivity (94%), followed by ddPCR (81%), and qPCR (51%), while specificities were similar across technologies [44]. These performance characteristics directly impact clinical utility, particularly in scenarios requiring high detection sensitivity such as post-treatment monitoring.
In colorectal cancer applications, dPCR demonstrated superior detection rates compared to NGS panel sequencing (58.5% vs. 36.6% in baseline plasma samples) [27]. This enhanced detection capability comes with an economic tradeoff, as dPCR operational costs are 5–8.5-fold lower than NGS, though higher than qPCR [27].
Practical Workflow Considerations
The implementation of ctDNA testing requires careful consideration of pre-analytical variables that impact assay performance. Sample collection methodology significantly influences result reliability, with plasma generally preferred over serum due to reduced background DNA from leukocyte lysis [93]. Specialized blood collection tubes containing stabilizing agents (e.g., Streck, Roche) preserve ctDNA integrity during transport and storage, enabling sample stability for up to 48 hours or longer [93].
For ctDNA extraction, silica membrane-based spin columns and magnetic bead-based methods are most commonly employed, with magnetic bead systems offering advantages for recovering the small DNA fragments characteristic of ctDNA [93]. Recent advancements in microfluidic extraction technologies show promise for improving yield while reducing processing time and manual intervention [93].
Experimental Protocols for ctDNA Analysis
Sample Collection and Processing Protocol
Proper sample handling is critical for reliable ctDNA detection. The following protocol outlines standardized procedures for plasma preparation from whole blood:
Blood Collection: Draw blood into specialized cell-free DNA BCT tubes (e.g., Streck Cell Free DNA BCT). Invert gently 8-10 times to mix preservative [27] [93].
Initial Centrifugation: Process samples within recommended timeframes (within 4 hours for EDTA tubes; up to 48-72 hours for specialized BCTs). Perform initial centrifugation at 800–1,900 × g for 10 minutes at room temperature to separate plasma from cellular components [93].
Secondary Centrifugation: Transfer supernatant to fresh tubes without disturbing the buffy coat. Centrifuge at 14,000–16,000 × g for 10 minutes to remove remaining cellular debris [93].
Plasma Storage: Aliquot cleared plasma into cryovials and store at -80°C until DNA extraction. Avoid repeated freeze-thaw cycles [93].
ctDNA Extraction Using Magnetic Bead-Based Methods
Magnetic bead-based extraction offers advantages for ctDNA recovery, particularly for smaller DNA fragments:
Lysis: Mix plasma sample with lysis buffer containing proteinase K. Incubate at 56–65°C for 30 minutes [93].
Binding: Add magnetic beads with binding buffer to the lysate. Incubate with mixing to allow DNA binding to beads [93].
Washing: Separate beads magnetically and remove supernatant. Wash twice with wash buffer [93].
Elution: Elute DNA in low-salt elution buffer or nuclease-free water. Pre-heat elution buffer to 65°C to improve yield [93].
Quality Assessment: Quantify cfDNA using fluorometric methods and assess fragment size distribution if possible [93].
dPCR Assay Setup and Analysis
The following protocol outlines a standard workflow for dPCR analysis of ctDNA:
Reaction Preparation: Prepare dPCR master mix according to manufacturer specifications. Include fluorescent probes specific for target mutations and reference genes [27] [43].
Partitioning: Load samples into dPCR chips or cartridges. Perform partitioning according to platform specifications (e.g., droplet generation or nanowell partitioning) [43] [94].
Amplification: Transfer partitions to thermal cycler and run amplification protocol with platform-specific cycling conditions [94].
Signal Reading: Analyze endpoints using fluorescence reader. For droplet-based systems, read droplets sequentially; for nanoplates, image all wells simultaneously [43].
Quantification: Apply Poisson statistics to calculate absolute copy numbers of target molecules based on positive and negative partition counts [67].
qPCR Assay for Mutation Detection
For laboratories utilizing qPCR platforms, the following protocol enables mutation detection in ctDNA:
Reaction Setup: Prepare qPCR master mix containing DNA polymerase, dNTPs, buffer, primers, and mutation-specific probes [9].
Plate Setup: Aliquot reactions into 96- or 384-well plates. Include standard curves for quantification and negative controls [9].
Amplification: Run real-time PCR protocol with platform-specific cycling conditions. Monitor fluorescence at each cycle [9].
Analysis: Determine Ct values for samples. Calculate mutant allele frequency using standard curves [9].
Research Reagent Solutions for ctDNA Analysis
Table 3: Essential Reagents and Materials for ctDNA Research
| Reagent/Material | Function | Application Notes |
|---|---|---|
| Cell-Free DNA BCT Tubes (e.g., Streck) | Preserves blood sample integrity | Enables sample stability for up to 48+ hours before processing [27] [93] |
| Magnetic Bead-Based Extraction Kits | Isolates ctDNA from plasma | Optimal recovery of small DNA fragments; automatable [93] |
| dPCR Supermix | Provides reaction components for amplification | Formulated for partitioning efficiency; probe- or dye-based options [94] |
| Mutation-Specific Probes/Primers | Detects tumor-specific mutations | Requires careful design and validation; tumor-informed or hotspot approaches [27] |
| dPCR Chips/Cartridges | Creates sample partitions | Platform-specific (e.g., nanowells, droplets); determines partition count [43] [94] |
The selection between dPCR and qPCR technologies for ctDNA detection involves careful consideration of analytical requirements, throughput needs, and economic constraints. dPCR offers superior sensitivity and absolute quantification capabilities essential for detecting low-frequency mutations in MRD monitoring and treatment response assessment [44] [43]. Conversely, qPCR provides cost-effective, high-throughput screening suitable for applications where extreme sensitivity is less critical [9].
Modern dPCR platforms addressing traditional limitations of throughput and cost are narrowing the practical implementation gap between these technologies [43] [94]. The emerging landscape suggests a complementary rather than competitive relationship, with each technology serving distinct application spaces within the ctDNA research workflow. Laboratories should align platform selection with specific research questions, clinical requirements, and operational constraints while maintaining standardized pre-analytical procedures to ensure result reliability across platforms.
The analysis of circulating tumor DNA (ctDNA) represents one of the most challenging applications in molecular diagnostics due to the exceptionally low abundance of tumor-derived DNA in circulation. In patients with early-stage cancer or minimal residual disease (MRD), ctDNA levels can fall below 0.1% of total cell-free DNA (cfDNA), creating a significant detection challenge [31] [1]. This technical constraint directly impacts the selection of appropriate PCR-based detection methods, particularly when weighing the relative advantages of digital PCR (dPCR) versus quantitative PCR (qPCR) platforms.
The dynamic range of an analytical method defines the span of concentrations over which it can provide accurate and reproducible quantification. This parameter becomes critically important in ctDNA analysis, where tumor content in plasma can vary dramatically from less than 0.01% in early-stage cancers to over 90% in advanced metastatic disease [1]. Understanding the fundamental limitations of each technology enables researchers to select the optimal platform for their specific experimental questions and clinical scenarios.
Comparative Performance of dPCR and qPCR
Technical Specifications and Performance Metrics
Digital PCR and quantitative PCR employ fundamentally different approaches to nucleic acid quantification, resulting in distinct performance characteristics for ctDNA detection. The table below summarizes the key technical differences between these platforms:
Table 1: Technical comparison of dPCR and qPCR platforms for ctDNA analysis
| Parameter | Digital PCR (dPCR) | Quantitative PCR (qPCR) |
|---|---|---|
| Quantification Method | Absolute counting via Poisson distribution | Relative quantification using standard curves |
| Detection Sensitivity | Can detect mutations as low as 0.1% [43] | Typically limited to >1% mutation detection [43] |
| Dynamic Range | Narrower dynamic range, may saturate at high concentrations [5] | Wide dynamic range (6-7 orders of magnitude) [5] |
| Impact of PCR Inhibitors | Higher tolerance due to sample partitioning [5] | More susceptible to inhibition effects [5] |
| Throughput | Lower throughput, more complex workflow [5] | High throughput with 96- or 384-well plates [5] |
| Cost Considerations | Higher instrument and reagent costs [5] | More cost-effective for large sample volumes [5] |
| Precision | Higher precision for rare targets and small fold changes [5] | Sufficient for most applications but limited for rare targets [5] |
Performance in Low Abundance ctDNA Detection
The exceptional sensitivity of dPCR for low-abundance targets stems from its fundamental working principle. By partitioning samples into thousands of individual reactions, dPCR effectively enriches rare targets and minimizes background noise, enabling detection of mutant allele frequencies as low as 0.1% [43]. This partitioning strategy also reduces the impact of PCR inhibitors, making dPCR more robust for analyzing complex clinical samples [5]. In contrast, qPCR struggles with rare mutation detection (<1%) due to limitations in distinguishing signal from background noise in bulk reactions [43].
Recent advancements in dPCR technology have further refined its application to challenging ctDNA scenarios. For breast cancer monitoring, novel approaches like the eSENSES panel have demonstrated capabilities to detect ctDNA levels below 1%, with high sensitivity and specificity achieved at 2-3% ctDNA levels [95]. Similarly, in SARS-CoV-2 detection studies, dPCR showed equal or superior sensitivity compared to RT-qPCR, particularly for low viral load samples [37].
Table 2: Application-based performance comparison for ctDNA analysis
| Application Scenario | Recommended Technology | Performance Considerations |
|---|---|---|
| Rare Mutation Detection | Digital PCR | Superior for mutant allele frequencies <1% [43] [5] |
| High-Throughput Screening | Quantitative PCR | More practical for large sample batches [5] |
| Copy Number Variation | Digital PCR | Higher precision without reference standards [43] |
| Gene Expression Analysis | Quantitative PCR | Established methodology with broad dynamic range [5] |
| Low Input Samples | Digital PCR | More resistant to inhibitors and efficient with limited material [5] |
| Absolute Quantification | Digital PCR | Direct molecule counting without standard curves [5] |
Experimental Protocols for ctDNA Analysis
Standardized Pre-analytical Workflow
The reliability of ctDNA analysis begins with meticulous sample collection and processing. The following protocol outlines a standardized approach for pre-analytical handling of blood samples for ctDNA analysis:
- Blood Collection: Draw blood using butterfly needles, collecting 2×10 mL tubes for single-analyte liquid biopsy. Avoid excessively thin needles and prolonged tourniquet use to prevent hemolysis [88].
- Collection Tubes: Use blood collection tubes (BCT) with cell-stabilizing preservative agents such as cfDNA BCT (Streck), PAXgene Blood ccfDNA (Qiagen), or similar products. These tubes maintain sample integrity for 3-7 days at 4-25°C, preventing genomic DNA contamination from white blood cell lysis [88] [39].
- Centrifugation Protocol: Perform double centrifugation:
- First step: 380-3,000 × g for 10 minutes at room temperature to separate plasma from blood cells
- Second step: 12,000-20,000 × g for 10 minutes at 4°C to remove residual cellular debris [88]
- Plasma Storage: Aliquot plasma and store at -80°C. For mutation detection, samples remain stable for up to 10 years, while quantitative analysis is reliable for up to 9 months [88].
- cfDNA Extraction: Employ solid-phase extraction methods using silica membrane columns (QIAamp Circulating Nucleic Acid Kit) or magnetic bead-based technologies (Maxwell RSC LV ccfDNA Kit) [88] [39]. Silica membrane-based kits typically yield more ctDNA than magnetic bead methods [88].
- Quality Control: Assess cfDNA concentration, fragment size distribution (predominantly 90-150 bp for ctDNA), and purity using Agilent TapeStation or similar platforms [39].
dPCR Assay Protocol for ctDNA Mutation Detection
The following protocol describes a validated workflow for detecting low-frequency mutations in ctDNA using digital PCR:
- Reaction Preparation: Prepare 20-40 μL reaction mixtures containing 2× ddPCR Supermix for probes (no dUTP), target-specific primers and probes (900 nM and 250 nM final concentrations, respectively), and 2-10 ng of extracted cfDNA [96].
- Partitioning: Load samples into dPCR chips (e.g., QuantStudio 3D digital PCR chips with 20,000 reaction wells) using appropriate partitioning instruments [96].
- Amplification: Perform PCR amplification with the following cycling conditions:
- Fluorescence Reading: Analyze partitions using a fluorescence detection system. For the QIAcuity nanoplate-based system, the integrated instrument performs simultaneous reading of all partitions [43].
- Data Analysis: Calculate absolute quantification of mutant and wild-type alleles using Poisson distribution statistics. Apply appropriate threshold settings to distinguish positive from negative partitions [96].
Digital PCR Workflow for ctDNA Analysis
Research Reagent Solutions
Table 3: Essential reagents and materials for ctDNA analysis using dPCR
| Reagent/Material | Function | Examples |
|---|---|---|
| Cell-Free DNA BCT Tubes | Preserves blood sample integrity during transport and storage | cfDNA BCT (Streck), PAXgene Blood ccfDNA (Qiagen) [88] |
| cfDNA Extraction Kits | Isolation and purification of cell-free DNA from plasma | QIAamp Circulating Nucleic Acid Kit (silica membrane), Maxwell RSC LV ccfDNA Kit (magnetic beads) [88] [39] |
| dPCR Supermix | Optimized reaction buffer for digital PCR amplification | ddPCR Supermix for probes (no dUTP) [96] |
| dPCR Chips/Cartridges | Microfluidic devices for sample partitioning | QuantStudio 3D digital PCR chips, QIAcuity nanoplate [96] [43] |
| Reference Standards | Quality control and assay validation | Seraseq ctDNA reference material, AcroMetrix ctDNA plasma controls [39] |
| Target-Specific Assays | Mutation detection primers and probes | Custom-designed TaqMan assays for hotspot mutations [43] |
Strategic Approaches to Overcome Technical Constraints
Optimizing Dynamic Range Limitations
The narrower dynamic range of dPCR presents challenges when analyzing samples with varying tumor burden. Strategic approaches to address this limitation include:
- Sample Dilution: For samples with expected high ctDNA fraction (>10%), implement predetermined dilution schemes to bring target concentrations within the optimal counting range of dPCR [5].
- Dual Platform Approach: Employ qPCR for initial sample screening to identify those with high ctDNA levels, followed by dPCR for precise quantification of low-abundance mutations in selected samples [5].
- Multi-volume Partitioning: Utilize platforms that enable analysis of different sample volumes to extend effective dynamic range, allowing quantification of both high and low abundance targets in the same experimental run.
Enhancing Sensitivity for Low Abundance Targets
When analyzing samples with very low ctDNA content (<0.1%), several techniques can enhance detection sensitivity:
- Increased Input Material: Process larger plasma volumes (4-6 mL) to increase the absolute number of mutant molecules available for detection [88].
- Short Fragment Enrichment: Utilize size-selection methods to enrich for shorter DNA fragments (90-150 bp) that are characteristic of ctDNA, thereby increasing the mutant allele fraction in the analyzed sample [31].
- Duplicate Sequencing Methods: Implement advanced error-correction methods like Duplex Sequencing or CODEC that tag both strands of DNA molecules to distinguish true mutations from PCR artifacts, significantly improving detection specificity [1].
Strategies for Enhancing Sensitivity
Economic Considerations and Workflow Efficiency
The higher cost and lower throughput of dPCR necessitate strategic implementation to maximize research value:
- Reflex Testing Model: Implement a cost-effective workflow using qPCR for initial screening and dPCR for confirmation of positive results or quantification of specific mutations of clinical significance [5].
- Batch Analysis: Organize sample processing into batches based on mutation targets to minimize reagent waste and optimize instrument usage [43].
- Automated Platforms: Utilize integrated dPCR systems like the QIAcuity that combine partitioning, thermocycling, and imaging in a fully automated instrument, reducing hands-on time and improving reproducibility [43].
The dynamic range and technical constraints of dPCR and qPCR present both challenges and opportunities in ctDNA research. dPCR offers superior sensitivity and absolute quantification for low-abundance targets but within a narrower dynamic range, while qPCR provides broader dynamic range and higher throughput at lower cost. The strategic researcher must consider these complementary strengths when designing experiments, potentially implementing both technologies in a tiered approach that maximizes their respective advantages. As ctDNA analysis continues to evolve toward earlier detection and minimal residual disease monitoring, understanding and navigating these technical limitations becomes increasingly critical for generating robust, reproducible, and clinically meaningful data.
Conclusion
The choice between dPCR and qPCR for ctDNA analysis is not a matter of one being universally superior, but rather of selecting the right tool for the specific application. qPCR remains a powerful, cost-effective solution for high-throughput screening and applications with abundant targets. In contrast, dPCR excels in scenarios demanding ultra-sensitive detection, absolute quantification, and robust performance in the presence of inhibitors—making it indispensable for monitoring minimal residual disease, detecting rare mutations, and assessing early treatment response. As the field of liquid biopsy advances, the integration of these technologies, alongside next-generation sequencing, will continue to refine non-invasive cancer monitoring and accelerate the development of personalized therapeutic strategies. Future efforts will focus on standardizing protocols, validating clinical utility through large-scale trials, and further improving multiplexing capabilities to unlock the full potential of ctDNA in precision oncology.
References
- 1. Circulating tumor DNA to monitor treatment response in ... [https://www.nature.com/articles/s41698-025-00876-y]
- 2. Advances in CTC and ctDNA detection techniques [https://breast-cancer-research.biomedcentral.com/articles/10.1186/s13058-025-02024-7]
- 3. Integrating Circulating Tumor DNA into Clinical Management ... [https://pmc.ncbi.nlm.nih.gov/articles/PMC12346868/]
- 4. Evaluating the analytical validity of circulating tumor DNA ... [https://pmc.ncbi.nlm.nih.gov/articles/PMC8434938/]
- 5. Digital PCR vs. Real-Time PCR: Understanding the Key ... [https://www.labmanager.com/digital-pcr-vs-real-time-pcr-understanding-the-key-differences-33665]
- 6. Digital PCR outperforms quantitative real-time PCR for the ... [https://pmc.ncbi.nlm.nih.gov/articles/PMC12288185/]
- 7. Comparing the Diagnostic Performance of Quantitative ... [https://www.sciencedirect.com/science/article/pii/S1525157823002921]
- 8. a roadmap for DNA methylation biomarkers in liquid biopsies [https://www.nature.com/articles/s41388-025-03624-5]
- 9. Quantitative or digital PCR? A comparative analysis for ... [https://www.sciencedirect.com/science/article/abs/pii/S0165993624001584]
- 10. Digital PCR [https://www.sigmaaldrich.com/US/en/technical-documents/protocol/genomics/pcr/digital-pcr?srsltid=AfmBOoqLboakqs-jI3V4i4EWlMteVPnaPArbDQVJZhnPAqQt5uMYMu1K]
- 11. Comparison of Droplet Digital PCR to Real-Time PCR for Quantitative Detection of Cytomegalovirus - PMC [https://pmc.ncbi.nlm.nih.gov/articles/PMC3553899/]
- 12. MIQE 2.0 and the Urgent Need to Rethink qPCR Standards [https://pmc.ncbi.nlm.nih.gov/articles/PMC12154065/]
- 13. Comparing the precision of two digital PCR applications for ... [https://pmc.ncbi.nlm.nih.gov/articles/PMC12297429/]
- 14. Comparative Performance of Digital PCR and Real-Time RT ... [https://pmc.ncbi.nlm.nih.gov/articles/PMC12474457/]
- 15. Comparison of reverse-transcription qPCR and droplet digital PCR for the detection of SARS-CoV-2 in clinical specimens of hospitalized patients - PMC [https://pmc.ncbi.nlm.nih.gov/articles/PMC8933867/]
- 16. 荧光检测原理-赛默飞| Thermo Fisher Scientific - CN [https://www.thermofisher.cn/cn/zh/home/references/molecular-probes-the-handbook/introduction-to-fluorescence-techniques.html]
- 17. qPCR Steps: Creating a Successful Experiment | IDT [https://www.idtdna.com/page/support-and-education/decoded-plus/successful-qpcr/]
- 18. PCR/qPCR Data Analysis [https://www.sigmaaldrich.com/US/en/technical-documents/technical-article/genomics/qpcr/data-analysis?srsltid=AfmBOoqGdop6DAS2PkQT179zwvKOCnRwhrVh_87Bw2lPEPvmssIB_eXY]
- 19. Absolute vs. Relative Quantification for qPCR [https://www.thermofisher.com/us/en/home/life-science/pcr/real-time-pcr/real-time-pcr-learning-center/real-time-pcr-basics/absolute-vs-relative-quantification-real-time-pcr.html]
- 20. Relative Quantification of Gene Expression Using qPCR [https://bitesizebio.com/29322/methods-relative-quantification-qpcr-data/]
- 21. Relative quantification of mRNA: comparison of methods ... [https://bmcmolbiol.biomedcentral.com/articles/10.1186/1471-2199-8-113]
- 22. Experimental comparison of relative RT-qPCR quantification ... [https://pmc.ncbi.nlm.nih.gov/articles/PMC2930637/]
- 23. Performance Comparison of Droplet Digital PCR and Next- ... [https://pubmed.ncbi.nlm.nih.gov/40346007/]
- 24. How Digital PCR Enables Early Molecular Relapse Detection [https://www.thermofisher.com/blog/behindthebench/early-molecular-relapse-detection-dpcr/]
- 25. The MIQE guidelines: minimum information for publication ... [https://pubmed.ncbi.nlm.nih.gov/19246619/]
- 26. dPCR: A Technology Review - PMC - PubMed Central [https://pmc.ncbi.nlm.nih.gov/articles/PMC5948698/]
- 27. Performance Comparison of Droplet Digital PCR and Next ... [https://pmc.ncbi.nlm.nih.gov/articles/PMC12062871/]
- 28. Mastering dMIQE Guidelines for the Publication of dPCR ... [https://www.thermofisher.com/us/en/home/life-science/pcr/digital-pcr/education/basic-research/mastering-dmiqe-guidelines.html]
- 29. Real-Time vs Digital vs Traditional PCR [https://www.thermofisher.com/lc/en/home/life-science/pcr/real-time-pcr/qpcr-education/qpcr-vs-digital-pcr-vs-traditional-pcr.html]
- 30. Applications of Digital PCR for Clinical Microbiology - PMC [https://pmc.ncbi.nlm.nih.gov/articles/PMC5442518/]
- 31. Monitoring and Assessment of Circulating Tumor DNA in ... [https://pmc.ncbi.nlm.nih.gov/articles/PMC12550271/]
- 32. Clinical validation of droplet digital PCR assays in ... [https://pubmed.ncbi.nlm.nih.gov/40250457/]
- 33. A comparative study of four cell-free DNA assays for detecting ... [https://breast-cancer-research.biomedcentral.com/articles/10.1186/s13058-025-02077-8]
- 34. Analytical evaluation of circulating tumor DNA sequencing ... [https://www.nature.com/articles/s41598-024-54361-w]
- 35. The Clinical Utility of Droplet Digital PCR for Profiling ... [https://pmc.ncbi.nlm.nih.gov/articles/PMC9776872/]
- 36. Digital PCR for Rare Mutation Detection [https://www.thermofisher.com/us/en/home/life-science/pcr/digital-pcr/mutation-detection.html]
- 37. Comparison of Digital PCR and Quantitative PCR with ... [https://pmc.ncbi.nlm.nih.gov/articles/PMC9705847/]
- 38. Establishing PNB-qPCR for quantifying minimal ctDNA ... [https://www.nature.com/articles/s41598-017-09137-w]
- 39. Standardized Workflow and Analytical Validation of Cell ... [https://pmc.ncbi.nlm.nih.gov/articles/PMC12293894/]
- 40. Quantitative PCR–Based Method to Assess Cell-Free DNA ... [https://www.sciencedirect.com/science/article/pii/S1525157822000745]
- 41. A Review of Circulating Tumor DNA (ctDNA) and the Liquid ... [https://pmc.ncbi.nlm.nih.gov/articles/PMC12032849/]
- 42. Circulating tumor DNA detection in MRD assessment and ... [https://pmc.ncbi.nlm.nih.gov/articles/PMC9646858/]
- 43. dPCR vs qPCR [https://www.qiagen.com/us/applications/digital-pcr/beginners/dpcr-vs-qpcr]
- 44. Comparing the Diagnostic Performance of Quantitative ... [https://pmc.ncbi.nlm.nih.gov/articles/PMC10918646/]
- 45. Personalized circulating tumor DNA dynamics inform ... [https://www.nature.com/articles/s41698-025-01084-4]
- 46. Revolution of Circulating Tumor DNA [https://pmc.ncbi.nlm.nih.gov/articles/PMC12192262/]
- 47. Circulating tumor DNA in colorectal cancer [https://pmc.ncbi.nlm.nih.gov/articles/PMC11961841/]
- 48. Circulating tumor DNA predicts prognosis at different time ... [https://pmc.ncbi.nlm.nih.gov/articles/PMC12507613/]
- 49. Feasibility of ctDNA in detecting minimal residual disease ... [https://www.frontiersin.org/journals/oncology/articles/10.3389/fonc.2024.1418696/full]
- 50. Evaluation of Bridge Capture technology for mutation ... [https://www.nature.com/articles/s41598-025-04827-2]
- 51. Detection of circulating tumor DNA in colorectal cancer ... [https://pubmed.ncbi.nlm.nih.gov/41239188/]
- 52. Droplet digital PCR is an accurate method to assess ... [https://pmc.ncbi.nlm.nih.gov/articles/PMC5997148/]
- 53. COL25A1 and METAP1D DNA methylation are promising ... [https://clinicalepigeneticsjournal.biomedcentral.com/articles/10.1186/s13148-024-01748-1]
- 54. Development and validation of a methylation-specific ... [https://www.nature.com/articles/s41598-025-15228-w]
- 55. Evaluation of epigenetic methylation biomarkers for the ... [https://www.nature.com/articles/s41598-023-35631-5]
- 56. Comparison of Quantitative PCR and Droplet Digital PCR ... [https://pmc.ncbi.nlm.nih.gov/articles/PMC4495218/]
- 57. Fundamentals of multiplexing with digital PCR - PMC - NIH [https://pmc.ncbi.nlm.nih.gov/articles/PMC5154634/]
- 58. Rules and Tips for PCR & qPCR Primer Design | IDT [https://www.idtdna.com/page/support-and-education/decoded-plus/how-to-design-primers-and-probes-for-pcr-and-qpcr/]
- 59. PCR Assay Optimization and Validation [https://www.sigmaaldrich.com/US/en/technical-documents/technical-article/genomics/pcr/assay-optimization-and-validation]
- 60. Guideline for the verification of digital PCR methods in ... [https://link.springer.com/article/10.1007/s00003-024-01516-6]
- 61. Insights into qPCR: Protocol, Detection Methods, and Analysis [https://www.the-scientist.com/insights-into-qpcr-protocol-detection-methods-and-analysis-71478]
- 62. An optimized protocol for stepwise optimization of real-time RT-PCR analysis | Horticulture Research [https://www.nature.com/articles/s41438-021-00616-w]
- 63. qPCR Assay Design Hub [https://www.thermofisher.com/us/en/home/life-science/pcr/real-time-pcr/real-time-pcr-assays/assay-design.html]
- 64. PCR inhibition in qPCR, dPCR and MPS—mechanisms and ... [https://pmc.ncbi.nlm.nih.gov/articles/PMC7072044/]
- 65. Digital PCR Applications: Environmental Pathogen ... [https://www.thermofisher.com/us/en/home/life-science/pcr/digital-pcr/education/basic-research/environmental-pathogen-quantification.html]
- 66. Partitioning and subsampling statistics in compartment-based ... [https://pmc.ncbi.nlm.nih.gov/articles/PMC10184943/]
- 67. Medical diagnostic value of digital PCR (dPCR) [https://www.sciencedirect.com/science/article/pii/S2667099223000221]
- 68. Digital PCR Partitions and Conquers [https://www.genengnews.com/insights/digital-pcr-partitions-and-conquers/]
- 69. Evaluation of PCR-enhancing approaches to reduce ... [https://www.sciencedirect.com/science/article/abs/pii/S0048969724069250]
- 70. Droplet Digital PCR: A Powerful Tool for Accurate ... [https://pmc.ncbi.nlm.nih.gov/articles/PMC12080313/]
- 71. Ten Tips for Successful qPCR - Behind the Bench [https://www.thermofisher.com/blog/behindthebench/ten-tips-for-successful-qpcr/]
- 72. qPCR primer design revisited - PMC - PubMed Central - NIH [https://pmc.ncbi.nlm.nih.gov/articles/PMC5702850/]
- 73. Preanalytical Errors in Clinical Laboratory Testing at a ... [https://pmc.ncbi.nlm.nih.gov/articles/PMC10981510/]
- 74. Non-disease variables [https://eclinpath.com/test-basics/non-disease-variables/]
- 75. Pre-Analytical Variables in the Clinical Chemistry Lab [https://www.selectscience.net/article/pre-analytical-variables-in-the-clinical-chemistry-lab]
- 76. Clinical Circulating Tumor DNA Testing for Precision Oncology [https://pmc.ncbi.nlm.nih.gov/articles/PMC10101787/]
- 77. Considerations and quality controls when analyzing cell ... [https://www.sciencedirect.com/science/article/pii/S2214753518300184]
- 78. The hidden limits of digital PCR and what comes next [https://countablelabs.com/blog/the-hidden-limits-of-digital-pcr-and-what-comes-next]
- 79. Whole-genome informed circulating tumor DNA analysis by ... [https://www.frontiersin.org/journals/oncology/articles/10.3389/fonc.2023.1176698/full]
- 80. The digital : Minimum Information for Publication of... MIQE guidelines [https://pubmed.ncbi.nlm.nih.gov/23570709/]
- 81. Obtaining Reliable RT-qPCR Results in Molecular ... [https://pmc.ncbi.nlm.nih.gov/articles/PMC8953338/]
- 82. MIQE Guidelines | Thermo Fisher Scientific - US [https://www.thermofisher.com/us/en/home/life-science/pcr/real-time-pcr/real-time-pcr-assays/why-choose-taqman-assays/publish-real-time-pcr-results.html]
- 83. Circulating Tumor DNA Detection by Digital-Droplet PCR in ... [https://pmc.ncbi.nlm.nih.gov/articles/PMC7956845/]
- 84. Digital PCR Applications | Thermo Fisher Scientific - ES [https://www.thermofisher.com/us/en/home/life-science/pcr/digital-pcr/applications.html]
- 85. Comparison of real-time quantitative PCR and two digital ... [https://www.sciencedirect.com/science/article/pii/S0022175924000139]
- 86. Detection of urine circulating tumor DNA using droplet ... [https://www.oaepublish.com/articles/2394-5079.2024.118]
- 87. dPCR Protocol [https://www.sigmaaldrich.com/US/en/technical-documents/protocol/genomics/qpcr/dpcr?srsltid=AfmBOopMUexSsAZWiBIzF0TLPPVDOppY4WHZnU7Bfk_IDiOp4da9nB_1]
- 88. Improvement of the sensitivity of circulating tumor DNA-based ... [https://pmc.ncbi.nlm.nih.gov/articles/PMC12332530/]
- 89. Digital PCR: from early developments to its future application ... [https://pubs.rsc.org/en/content/articlehtml/2025/lc/d5lc00055f]
- 90. Precision performance of Crystal Digital PCR vs. ... [https://www.stillatechnologies.com/digital-pcr/naica-system-analysis/precision-performance-of-crystal-digital-pcr-vs-quantitative-pcr/]
- 91. Digital PCR dynamic range is approaching that of real-time ... [https://pmc.ncbi.nlm.nih.gov/articles/PMC5154633/]
- 92. Digital PCR and Real-time PCR(qPCR) 2025-2033 Analysis [https://www.marketreportanalytics.com/reports/digital-pcr-and-real-time-pcrqpcr-314646]
- 93. Circulating tumor DNA laboratory processes and clinical ... [https://www.frontiersin.org/journals/oncology/articles/10.3389/fonc.2025.1520733/full]
- 94. An integrated digital PCR system with high universality and ... [https://www.frontiersin.org/journals/bioengineering-and-biotechnology/articles/10.3389/fbioe.2022.947895/full]
- 95. Enabling sensitive and precise detection of ctDNA through ... [https://www.nature.com/articles/s41523-025-00739-6]
- 96. An integrated digital PCR system with high universality and ... [https://pmc.ncbi.nlm.nih.gov/articles/PMC9437218/]