Epigenetic Control of Cancer Stem Cell Biomarkers: Mechanisms, Methods, and Therapeutic Implications
This article provides a comprehensive review of the epigenetic regulation of cancer stem cell (CSC) biomarker expression, targeting researchers, scientists, and drug development professionals.
Epigenetic Control of Cancer Stem Cell Biomarkers: Mechanisms, Methods, and Therapeutic Implications
Abstract
This article provides a comprehensive review of the epigenetic regulation of cancer stem cell (CSC) biomarker expression, targeting researchers, scientists, and drug development professionals. We first establish the foundational link between core epigenetic mechanisms—DNA methylation, histone modifications, and non-coding RNAs—and the dynamic expression of key CSC surface markers (e.g., CD44, CD133, ALDH1) and functional markers. We then detail current methodologies for profiling these epigenetic landscapes in CSCs, including bisulfite sequencing, ChIP-seq, and ATAC-seq, and explore applications in identifying druggable targets. The article addresses common technical challenges in epigenetic-CSC studies and offers optimization strategies for assay specificity and sensitivity. Finally, we compare and validate emerging epigenetic therapies, such as DNMT/HDAC inhibitors and epidrugs, against conventional approaches, evaluating their efficacy in modulating CSC phenotypes and overcoming therapy resistance. The synthesis aims to bridge mechanistic understanding with translational applications for novel anti-CSC therapies.
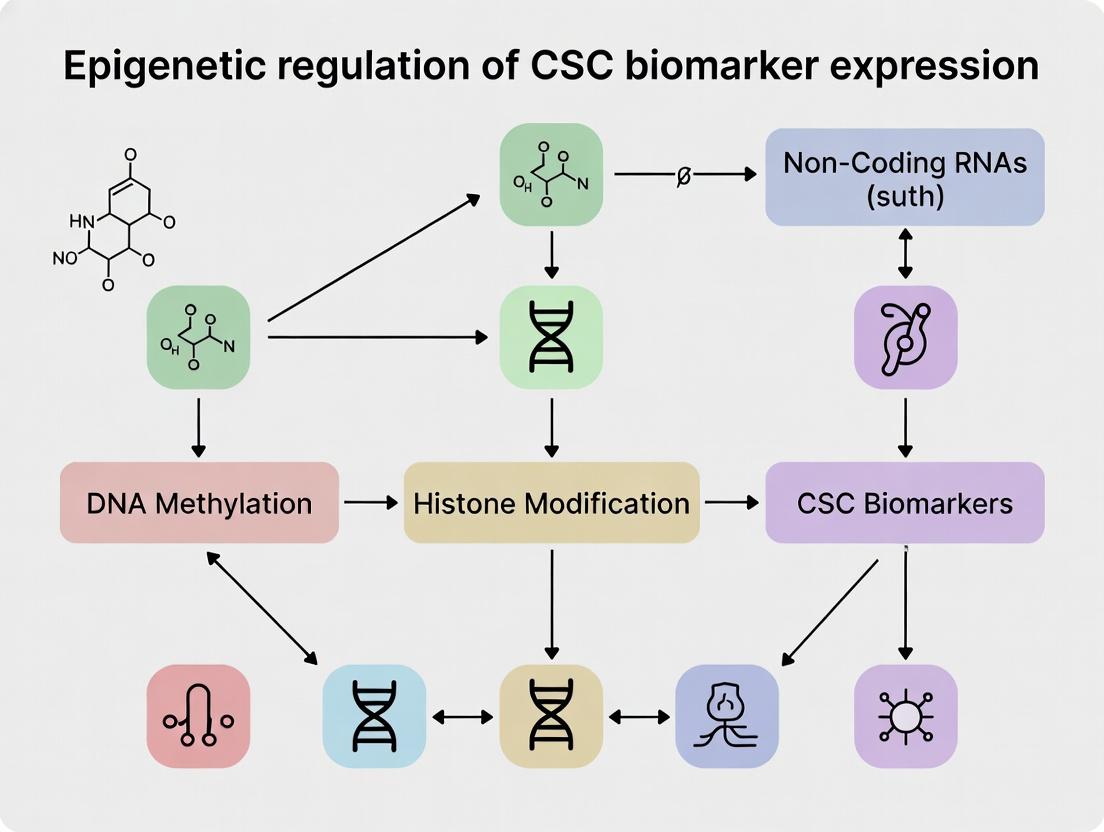
Unraveling the Epigenetic Code: How DNA and Histone Modifications Govern Cancer Stem Cell Identity
Within the broader thesis on the epigenetic regulation of cancer stem cell (CSC) biomarker expression, defining the core epigenetic mechanisms governing cell fate is paramount. CSCs, a subpopulation with self-renewal and tumor-initiating capacities, are believed to be maintained by a unique epigenetic landscape that regulates key biomarkers like CD44, CD133, and ALDH1. This whitepaper provides an in-depth technical guide to the core mechanisms—DNA methylation, histone modifications, and chromatin remodeling—that establish this landscape, directly influencing cellular differentiation states and CSC plasticity. Understanding these mechanisms is critical for developing epigenetic therapies aimed at eradicating CSCs.
Core Mechanisms of Epigenetic Regulation
DNA Methylation
DNA methylation involves the covalent addition of a methyl group to the 5-carbon of cytosine, primarily within CpG dinucleotides, catalyzed by DNA methyltransferases (DNMTs). In differentiated cells, promoter CpG islands are typically unmethylated, allowing gene expression. Hypermethylation of tumor suppressor gene promoters is a hallmark of cancer, while global hypomethylation can lead to genomic instability. In CSCs, specific methylation patterns silence differentiation-promoting genes and potentially regulate biomarker expression.
Key Quantitative Data: DNA Methylation in CSCs
| Metric | Typical Value in Somatic Cells | Typical Value in CSCs | Key Implication for CSC Biomarkers |
|---|---|---|---|
| Global 5mC Level | ~70-80% of CpGs | Often reduced (60-75%) | Genomic instability, oncogene activation. |
| Promoter CpG Island Methylation | <10% of gene promoters | Hypermethylation of 5-15% additional promoters | Silencing of differentiation genes (e.g., CDKN2A). |
| DNMT1 Expression | Baseline maintenance | Often upregulated | Maintains aberrant methylation patterns. |
| DNMT3B Expression | Low in most tissues | Frequently overexpressed | De novo methylation of stemness/differentiation genes. |
Experimental Protocol: Bisulfite Sequencing for Methylation Analysis
- Objective: To map cytosine methylation at single-nucleotide resolution.
- Reagents: Genomic DNA, sodium bisulfite conversion kit (e.g., EZ DNA Methylation Kit), PCR reagents, sequencing primers.
- Procedure:
- Bisulfite Conversion: Treat 500 ng of genomic DNA with sodium bisulfite, which converts unmethylated cytosines to uracil, while methylated cytosines remain unchanged.
- Purification: Desalt and purify the converted DNA.
- PCR Amplification: Design primers specific to the bisulfite-converted sequence of your target region (e.g., promoter of a CSC biomarker gene). Amplify the region.
- Sequencing: Clone the PCR product or perform direct next-generation sequencing (NGS).
- Analysis: Compare the sequence to the unconverted reference. Cytosines that read as thymines (from uracil) were unmethylated; those reading as cytosines were methylated. Calculate the percentage methylation per CpG site.
Histone Modifications
Histone tails are subject to over 100 post-translational modifications (PTMs), including methylation, acetylation, and phosphorylation. These PTMs alter chromatin structure and recruit effector proteins. The "histone code" hypothesis posits that combinations of modifications dictate functional outcomes. In CSCs, bivalent domains (co-existing H3K4me3 activation and H3K27me3 repression marks) at promoters of developmental regulators are common, poising them for rapid activation or silencing.
Key Quantitative Data: Common Histone Marks in Cell Fate
| Histone Mark | Associated Function | Enrichment in Pluripotent/CSC State | Effect on Target Genes |
|---|---|---|---|
| H3K4me3 | Transcriptional activation | At promoters of active stemness genes (OCT4, NANOG) | Promotes expression. |
| H3K27me3 | Transcriptional repression (Polycomb) | At promoters of lineage-specification genes in bivalent domains | Maintains repression, poises for activation. |
| H3K9me3 | Heterochromatin formation | At repetitive elements, silenced genes | Stable long-term repression. |
| H3K9ac / H3K27ac | Transcriptional activation | At active enhancers and promoters | Opens chromatin, recruits co-activators. |
Experimental Protocol: Chromatin Immunoprecipitation Sequencing (ChIP-seq)
- Objective: To identify genome-wide binding sites of a protein (e.g., modified histone) of interest.
- Reagents: Crosslinked cells, specific antibody against histone mark (e.g., anti-H3K27me3), Protein A/G beads, sequencing library prep kit.
- Procedure:
- Crosslinking & Sonication: Fix cells with formaldehyde to crosslink proteins to DNA. Lyse cells and shear chromatin via sonication to ~200-500 bp fragments.
- Immunoprecipitation: Incubate chromatin with specific antibody overnight. Capture antibody-chromatin complexes with Protein A/G beads.
- Washing & Elution: Wash beads stringently to remove non-specific binding. Elute and reverse crosslinks.
- DNA Purification: Purify the co-precipitated DNA.
- Library Prep & Sequencing: Prepare an NGS library from the immunoprecipitated DNA and sequence.
- Analysis: Map sequence reads to a reference genome and identify enriched regions (peaks) using tools like MACS2.
Chromatin Remodeling
ATP-dependent chromatin remodeling complexes use ATP hydrolysis to slide, evict, or restructure nucleosomes, regulating DNA accessibility. SWI/SNF-family complexes typically open chromatin (e.g., promoting expression of tumor suppressors), while ISWI and CHD families often compact it. Mutations in remodeling complex subunits (e.g., ARID1A in SWI/SNF) are frequent in cancers and can alter the expression of CSC-related genes.
Key Quantitative Data: Chromatin Remodeler Activity
| Complex Family | Primary ATPase | Typical Nucleosome Alteration | Common Role in CSCs |
|---|---|---|---|
| SWI/SNF (cBAF) | BRG1 / BRM | Sliding, eviction; opens chromatin | Mutually exclusive with Polycomb repression; often mutated. |
| ISWI | SMARCA5 (SNF2H) | Spacing, assembly; compacts chromatin | Maintains repressed state. |
| CHD | CHD1, CHD4 | Sliding, eviction (varies) | CHD4 in NuRD complex represses differentiation genes. |
| INO80 | INO80 | Exchange of histone variants | Promotes DNA repair, stemness. |
Experimental Protocol: Assay for Transposase-Accessible Chromatin with Sequencing (ATAC-seq)
- Objective: To map genome-wide chromatin accessibility.
- Reagents: Live or frozen nuclei, Tn5 transposase (loaded with sequencing adapters), PCR reagents.
- Procedure:
- Nuclei Isolation: Lyse cells in a gentle, non-ionic detergent to isolate intact nuclei.
- Tagmentation: Incubate nuclei with the engineered Tn5 transposase. Tn5 simultaneously cuts accessible DNA and inserts sequencing adapters.
- DNA Purification: Purify the tagmented DNA.
- PCR Amplification: Amplify the library with primers complementary to the adapter sequences.
- Sequencing & Analysis: Sequence the library. Reads correspond to open chromatin regions. Peaks are called to identify promoters, enhancers, and insulators.
The Scientist's Toolkit: Key Research Reagent Solutions
| Reagent / Material | Primary Function | Example in Epigenetic Research |
|---|---|---|
| DNMT Inhibitors (e.g., 5-Azacytidine) | Nucleoside analog incorporated into DNA, irreversibly binding and depleting DNMTs. | Used to demethylate and reactivate silenced tumor suppressor genes in cell lines. |
| HDAC Inhibitors (e.g., Trichostatin A) | Block histone deacetylase activity, leading to histone hyperacetylation and open chromatin. | Tool to study the role of acetylation in gene activation; some are FDA-approved drugs. |
| EZH2 (PRC2) Inhibitors (e.g., GSK126) | Specifically inhibit the catalytic subunit of Polycomb Repressive Complex 2. | Used to deplete H3K27me3 marks and assess its role in maintaining CSC repression programs. |
| Bisulfite Conversion Kit | Chemically converts unmethylated cytosine to uracil for methylation detection. | Essential first step for pyrosequencing, bisulfite sequencing, or methylation-specific PCR. |
| ChIP-Grade Antibody | High-specificity antibody validated for chromatin immunoprecipitation. | Critical for successful ChIP-seq/qPCR targeting specific histone marks or chromatin proteins. |
| Tn5 Transposase (Tagmentase) | Enzyme that simultaneously fragments DNA and adds sequencing adapters in open chromatin. | Core reagent for ATAC-seq workflows to profile chromatin accessibility. |
| Methylated DNA Immunoprecipitation (MeDIP) Kit | Uses an antibody against 5-methylcytosine to enrich for methylated DNA sequences. | Alternative method for genome-wide methylation profiling without bisulfite conversion. |
Visualizations of Core Concepts
Title: Epigenetic Mechanisms Shape Chromatin States and Gene Output
Title: ChIP-seq Experimental Workflow for Histone Marks
Within the broader thesis on epigenetic regulation of cancer stem cell (CSC) biomarker expression, this guide details the core biomarkers used to identify, isolate, and study CSCs. These cells, characterized by self-renewal, differentiation capacity, and tumor-initiating potential, are central to therapeutic resistance and metastasis. Their biomarker profile is not static but dynamically regulated by epigenetic mechanisms, including DNA methylation, histone modifications, and non-coding RNA activity, which in turn influence cellular plasticity and tumor heterogeneity.
Surface Markers
Surface markers are transmembrane proteins used for the physical isolation of CSC populations via fluorescence-activated cell sorting (FACS) or magnetic-activated cell sorting (MACS).
CD44
A cell surface glycoprotein involved in cell-cell interactions, adhesion, and migration. The CD44 variant isoforms (e.g., CD44v) are frequently overexpressed in CSCs and interact with hyaluronic acid.
CD133 (Prominin-1)
A pentaspan transmembrane glycoprotein localized to cellular protrusions. Its expression is associated with stemness in various cancers, though its utility as a standalone marker is debated.
EpCAM (Epithelial Cell Adhesion Molecule)
A type I transmembrane glycoprotein mediating homotypic calcium-independent cell adhesion. It is a key marker for carcinomas and is involved in proliferation and Wnt signaling.
Table 1: Key Surface Markers in Common Cancers
| Marker | Common Cancer Types | Primary Function | Epigenetic Regulation Notes |
|---|---|---|---|
| CD44 | Breast, Colon, Pancreatic, HNSCC | Cell adhesion, migration, hyaluronan receptor, signal transduction | Expression potentiated by hypomethylation of promoter/enhancer regions; regulated by histone H3 lysine 4 trimethylation (H3K4me3). |
| CD133 | Brain (Glioblastoma), Colon, Liver, Pancreatic | Membrane organization, potential role in PI3K/Akt pathway | Promoter methylation status inversely correlates with expression; regulated by polycomb repressive complexes (PRC2). |
| EpCAM | Colon, Breast, Pancreatic, Ovarian | Cell adhesion, proliferation, modulates Wnt/β-catenin signaling | Transcriptional activation linked to demethylation of specific CpG sites; subject to dynamic histone acetylation changes. |
Functional Markers
Functional markers are intracellular proteins or enzymatic activities that signify stem cell-like properties.
ALDH1 (Aldehyde Dehydrogenase 1)
The ALDH enzyme family, particularly ALDH1A1, detoxifies intracellular aldehydes and is a functional marker of stemness. High ALDH activity, measured by the ALDEFLUOR assay, identifies CSCs with enhanced detoxification and self-renewal.
SOX2, OCT4, NANOG
These are core transcription factors of the pluripotency network. They maintain self-renewal and inhibit differentiation. Their aberrant expression in cancers promotes stemness and is tightly controlled by epigenetic modifiers.
Table 2: Key Functional and Intracellular Markers
| Marker | Type | Localization | Role in Stemness | Epigenetic Regulation Notes |
|---|---|---|---|---|
| ALDH1 (High Activity) | Enzymatic Activity | Cytoplasm | Detoxification, retinoic acid synthesis, resistance | ALDH1A1 promoter hypomethylation associated with high expression; histone deacetylases (HDACs) can modulate expression. |
| SOX2 | Transcription Factor | Nucleus | Maintenance of self-renewal and pluripotency | Expression maintained by open chromatin marks (e.g., H3K27ac); repressed by DNA methylation and PRC1/2 complexes. |
| OCT4 (POU5F1) | Transcription Factor | Nucleus | Core pluripotency regulator, self-renewal | Dynamically regulated by promoter methylation; bivalent chromatin domains (H3K4me3/H3K27me3) are common in cancers. |
| NANOG | Transcription Factor | Nucleus | Supports pluripotency, prevents differentiation | Promoter demethylation correlates with aberrant expression; interacts with multiple chromatin remodeling complexes. |
Experimental Protocols for Key Assays
Protocol 1: Fluorescence-Activated Cell Sorting (FACS) for Surface Markers
Objective: Isolate a live CSC population based on surface marker expression (e.g., CD44+/CD24- for breast cancer). Materials: Single-cell suspension from tumor dissociation, PBS + 2% FBS (FACS buffer), fluorescently conjugated antibodies (e.g., anti-CD44-FITC, anti-CD24-PE), viability dye (e.g., DAPI or 7-AAD), cell sorter. Procedure:
- Prepare a single-cell suspension and filter through a 40 µm strainer.
- Count cells and aliquot 1x10^6 cells per staining tube.
- Centrifuge at 300 x g for 5 min, discard supernatant.
- Resuspend pellet in 100 µL FACS buffer containing pre-titrated antibody cocktail and viability dye. Incubate for 30 min at 4°C in the dark.
- Wash cells with 2 mL FACS buffer, centrifuge, and resuspend in 500 µL FACS buffer.
- Pass through a cell strainer snap cap into a FACS tube.
- Perform sorting using appropriate gating: first, gate on live, single cells, then on the desired marker profile (e.g., CD44+ CD24-).
- Collect sorted cells into collection tubes containing growth medium for downstream applications.
Protocol 2: ALDEFLUOR Assay for ALDH Activity
Objective: Identify and isolate cells with high ALDH enzymatic activity. Materials: ALDEFLUOR kit (contains BODIPY-aminoacetaldehyde substrate, DEAB inhibitor), serum-free assay buffer, FACS tubes. Procedure:
- Prepare a single-cell suspension at 1x10^6 cells/mL in assay buffer.
- Divide suspension into two tubes: "test" and "DEAB control" (each ~0.5-1 mL).
- Add ALDEFLUOR substrate to the "test" tube per manufacturer's instructions.
- To the "DEAB control" tube, add the specific ALDH inhibitor diethylaminobenzaldehyde (DEAB), then add substrate.
- Incubate both tubes at 37°C for 30-60 min.
- Centrifuge cells, resuspend in ice-cold assay buffer, and keep on ice.
- Analyze by flow cytometry. The ALDH-high population is defined as the brightly fluorescent cell population present in the "test" sample but absent in the DEAB-inhibited control.
Protocol 3: Chromatin Immunoprecipitation (ChIP) for Epigenetic Analysis
Objective: Assess histone modifications or transcription factor binding at CSC gene promoters (e.g., H3K27ac at SOX2 enhancer). Materials: Crosslinked cells, sonicator, specific antibody (e.g., anti-H3K27ac), protein A/G beads, DNA purification kit, qPCR primers for target region. Procedure:
- Crosslink proteins to DNA by adding formaldehyde (final 1%) to cells for 10 min at room temp. Quench with glycine.
- Lyse cells and isolate nuclei. Sonicate chromatin to shear DNA to 200-500 bp fragments.
- Clarify lysate by centrifugation. Aliquot chromatin as "input" control and for immunoprecipitation (IP).
- Pre-clear chromatin with beads for 1 hour.
- Incubate chromatin overnight at 4°C with target-specific antibody or control IgG.
- Add protein A/G beads to capture antibody complexes. Wash beads extensively.
- Reverse crosslinks: elute complexes and incubate at 65°C overnight with NaCl.
- Treat with RNase A and Proteinase K. Purify DNA.
- Analyze enrichment of specific genomic regions by quantitative PCR (qPCR), comparing % input from IP vs. control IgG.
The Scientist's Toolkit: Research Reagent Solutions
Table 3: Essential Research Reagents and Materials
| Item | Supplier Examples | Function in CSC Research |
|---|---|---|
| Anti-human CD44, APC conjugate | BioLegend, BD Biosciences | Antibody for FACS/MACS isolation of CD44+ CSCs. |
| Anti-human CD133/1 (AC133) PE | Miltenyi Biotec | Antibody for detection and sorting of CD133+ cell populations. |
| ALDEFLUOR Kit | StemCell Technologies | Functional assay to identify cells with high ALDH activity. |
| MACS Cell Separation Kits | Miltenyi Biotec | Magnetic bead-based separation for specific surface markers. |
| OCT4/SOX2/NANOG Antibodies | Cell Signaling Technology, Abcam | For immunoblotting or immunofluorescence to detect core pluripotency factors. |
| HDAC Inhibitors (e.g., Trichostatin A) | Sigma-Aldrich, Cayman Chemical | Tool compounds to study the role of histone acetylation in regulating CSC marker expression. |
| DNMT Inhibitors (e.g., 5-Azacytidine) | Sigma-Aldrich | Tool compounds to study the role of DNA methylation in silencing/activating CSC genes. |
| ChIP-Validated Antibodies (e.g., H3K4me3) | Active Motif, Abcam | For mapping epigenetic modifications at CSC gene loci. |
| Matrigel | Corning | Basement membrane matrix for 3D spheroid (tumorsphere) assays to assess CSC self-renewal. |
Visualizations of Key Pathways and Workflows
Title: Epigenetic Regulation of Core Pluripotency Network
Title: CSC Isolation and Characterization Workflow
This whitepaper serves as a core chapter in a broader thesis on "Epigenetic Regulation of CSC Biomarker Expression Research." It focuses specifically on the direct mechanistic role of cytosine-guanine dinucleotide (CpG) island methylation within gene promoter regions in the transcriptional control of canonical Cancer Stem Cell (CSC) marker genes. This regulation is fundamental to the CSC phenotype, influencing self-renewal, tumor initiation, therapeutic resistance, and metastatic potential.
Foundational Principles: Promoter Methylation and Transcriptional Control
DNA methylation, catalyzed by DNA methyltransferases (DNMTs), involves the addition of a methyl group to the 5' carbon of cytosine, primarily within CpG islands. The transcriptional outcome—silencing or activation—depends on the precise genomic and epigenetic context.
Silencing Mechanism: Methylation of promoter CpG islands typically leads to gene repression through two primary mechanisms:
- Direct Inhibition: Methyl-CpG-binding domain (MBD) proteins bind methylated DNA and recruit chromatin remodeling complexes, including histone deacetylases (HDACs) and histone methyltransferases (HMTs). This results in a condensed, transcriptionally inactive heterochromatin state.
- Indirect Inhibition: Methylation can block the binding of transcription factors (TFs) that require unmethylated CpG dinucleotides for interaction with their target sequences.
Activation Mechanism: Conversely, methylation within gene bodies or at specific non-promoter regulatory elements (e.g., enhancers) can sometimes correlate with gene expression. More critically, hypomethylation of a promoter—the loss of methyl groups—is permissive for transcription factor binding and the establishment of an active chromatin state, leading to gene activation.
CSC Marker Genes: Targets of Promoter Methylation
The expression of key CSC markers is directly governed by their promoter methylation status. The table below summarizes the relationship for major markers.
Table 1: Promoter Methylation Status and Expression of Key CSC Marker Genes
| CSC Marker Gene | Common Cancer Type(s) | Typical Promoter Methylation Status in CSCs | Effect on Expression in CSCs | Functional Consequence |
|---|---|---|---|---|
| CD44 | Breast, Colorectal, Pancreatic | Hypomethylated | Activated | Promotes cell adhesion, migration, and stem-like signaling (e.g., via RTK activation). |
| ALDH1A1 | Breast, Ovarian, Lung | Hypomethylated | Activated | Increases retinoic acid production, contributing to differentiation resistance and detoxification. |
| PROM1 (CD133) | Glioblastoma, Colon, Liver | Variable; often hypomethylated in aggressive subsets | Activated/Modulated | Maintains self-renewal capacity and tumorigenic potential; exact role is context-dependent. |
| ABCG2 | Multiple (Breast, Lung) | Hypermethylated in some contexts; hypomethylated in resistant clones | Often silenced; activated in specific resistant populations | When expressed, mediates the side population phenotype and chemotherapeutic drug efflux. |
| SOX2 | Glioblastoma, Lung, Esophageal | Hypermethylated in some lineages; hypomethylated in others (context-dependent) | Context-dependent silencing or activation | A core pluripotency factor; its expression reinforces the stem cell state. |
| NANOG | Various Solid Tumors | Often hypomethylated | Activated | Works with OCT4 and SOX2 to maintain self-renewal and pluripotency networks. |
| BMI1 | Leukemia, Breast, Neural | Frequently hypomethylated | Activated | Polycomb group protein; represses tumor suppressors (e.g., p16INK4a) to enable proliferation. |
| KLF4 | Colorectal, Breast | Often hypermethylated | Silenced | When silenced, removes a barrier to dedifferentiation and unchecked proliferation. |
Detailed Experimental Protocols
Protocol: Methylation-Specific PCR (MSP) for CSC Marker Promoter Analysis
Objective: To determine the methylation status of specific CpG sites within the promoter region of a target CSC marker gene (e.g., CD133).
Reagents & Materials: Bisulfite conversion kit (e.g., EZ DNA Methylation-Lightning Kit), PCR reagents, MSP primers (designed for methylated and unmethylated sequences after bisulfite conversion), agarose gel electrophoresis supplies.
Procedure:
- Genomic DNA Isolation: Extract high-quality DNA from sorted CSC and non-CSC populations.
- Bisulfite Conversion: Treat 500 ng of DNA with sodium bisulfite using a commercial kit. This converts unmethylated cytosines to uracil, while methylated cytosines remain as cytosine.
- PCR Amplification:
- Set up two separate PCR reactions for each sample: one with Methylated (M)-specific primers and one with Unmethylated (U)-specific primers.
- PCR Cycle: 95°C for 5 min; 35-40 cycles of (95°C for 30s, primer-specific Tm for 30s, 72°C for 30s); 72°C for 7 min.
- Analysis: Resolve PCR products on a 2-3% agarose gel. The presence of a band in the M reaction indicates methylated promoter sequences; a band in the U reaction indicates unmethylated sequences.
Protocol: Chromatin Immunoprecipitation (ChIP) for Methylation-Dependent Protein Binding
Objective: To assess the enrichment of transcriptional repressors (e.g., MBD2) or activators at the methylated/unmethylated promoter of a CSC gene (e.g., SOX2).
Reagents & Materials: Crosslinking reagent (formaldehyde), cell lysis buffers, sonicator, antibody against target protein (e.g., anti-MBD2, anti-H3K9me3, anti-RNA Polymerase II), Protein A/G beads, DNA purification kit, qPCR reagents with primers flanking the promoter region of interest.
Procedure:
- Crosslinking & Sonication: Fix cells with 1% formaldehyde for 10 min. Quench with glycine. Lyse cells and shear chromatin via sonication to ~200-500 bp fragments.
- Immunoprecipitation: Pre-clear chromatin lysate. Incubate an aliquot with 2-5 µg of specific antibody or control IgG overnight at 4°C. Add Protein A/G beads for 2 hours to capture antibody-chromatin complexes.
- Washing & Elution: Wash beads stringently. Elute bound chromatin complexes and reverse crosslinks at 65°C overnight.
- DNA Analysis: Purify DNA. Analyze by quantitative PCR (qPCR) using primers for the target promoter. Calculate % input or fold enrichment relative to IgG control.
Visualizing Key Pathways and Workflows
Title: DNA Methylation-Mediated Gene Silencing Pathway
Title: Workflow for Analyzing CSC Gene Promoter Methylation
The Scientist's Toolkit: Key Research Reagent Solutions
Table 2: Essential Reagents for Investigating Promoter Methylation in CSCs
| Reagent/Material | Primary Function | Example/Supplier Note |
|---|---|---|
| DNA Methyltransferase Inhibitors (DNMTi) | Pharmacologically demethylate DNA; used to test functional impact of methylation on gene expression. | 5-Azacytidine (Sigma-Aldrich), Decitabine. |
| Bisulfite Conversion Kits | Chemically modify DNA to distinguish methylated (C) from unmethylated (U) cytosines for downstream analysis. | EZ DNA Methylation Kits (Zymo Research), MethylCode Kit (Thermo Fisher). |
| Methylation-Specific PCR (MSP) Primers | Amplify sequences specific to methylated or unmethylated DNA post-bisulfite conversion. | Must be designed using software (e.g., MethPrimer) for target promoter. |
| Pyrosequencing Assays | Provide quantitative, single-base resolution methylation data across multiple CpG sites. | Qiagen PyroMark systems; assays require specific design. |
| Methylated DNA Immunoprecipitation (MeDIP) Kits | Use an antibody against 5-methylcytosine to pull down methylated genomic DNA fragments for sequencing or array analysis. | MagMeDIP Kit (Diagenode). |
| Chromatin IP (ChIP)-Grade Antibodies | Immunoprecipitate proteins bound to methylated DNA or associated histone marks. | Anti-5mC, Anti-MBD2 (Abcam), Anti-H3K9me3 (Cell Signaling). |
| Fluorescence-Activated Cell Sorting (FACS) Antibodies | Isolate live CSC populations based on surface marker expression for comparative methylation studies. | Anti-CD44-APC, Anti-CD133/1-PE (Miltenyi Biotec). |
| Next-Generation Sequencing Services | For genome-wide methylation profiling (e.g., Whole Genome Bisulfite Sequencing) of sorted CSCs. | Illumina EPIC arrays or WGBS services (e.g., Novogene). |
Within the broader thesis on epigenetic regulation of Cancer Stem Cell (CSC) biomarker expression, understanding the antagonistic histone codes H3K27me3 and H3K4me3 is paramount. CSCs, a subpopulation driving tumor initiation, metastasis, and therapy resistance, exhibit unique transcriptional programs maintained by a dynamic epigenetic landscape. The bivalent chromatin domains, co-decorated by these opposing marks, poise key developmental and stemness genes for rapid activation or stable silencing, defining CSC plasticity and fate. This whitepaper dissects the mechanisms, interplay, and experimental interrogation of these marks in regulating CSC transcriptional networks.
Core Mechanisms and Molecular Players
H3K4me3 (Activation): Deposited by COMPASS-like complexes (e.g., MLL1-4, SET1A/B), this mark at gene promoters recruits chromatin remodelers, general transcription factors, and mediator complexes to facilitate transcriptional initiation. It is associated with open, accessible chromatin.
H3K27me3 (Repression): Catalyzed by Polycomb Repressive Complex 2 (PRC2) core (EZH2, SUZ12, EED), this mark compacts chromatin and recruits PRC1, leading to facultative heterochromatin formation and stable gene silencing.
Bivalent Domains in CSCs: Co-occurrence of H3K4me3 and H3K27me3 at promoters of developmentally critical genes (e.g., SOX2, NANOG, POUSF1/OCT4) creates a "poised" state, allowing rapid, context-specific resolution to either active or repressive states upon differentiation or self-renewal signals.
Table 1: Key Enzymes and Complexes Involved
| Histone Mark | Writer Complex | Eraser | Reader Domain/Protein |
|---|---|---|---|
| H3K4me3 | COMPASS/MLL, SET1A/B | KDM5 family, LSD1 | PHD fingers, TAF3, BPTF |
| H3K27me3 | PRC2 (EZH1/2) | KDM6A (UTX), KDM6B (JMJD3) | CBX proteins in PRC1 |
Quantitative Dynamics in CSC Populations
Recent studies highlight the quantitative imbalance of these marks in CSCs versus non-CSC tumor cells and normal stem cells.
Table 2: Representative Quantitative Data from Recent Studies
| Study (Model) | Key Finding | H3K4me3 Level (CSC vs. Non-CSC) | H3K27me3 Level (CSC vs. Non-CSC) | Measured Technique |
|---|---|---|---|---|
| Glioblastoma CSCs (2023) | Bivalent CD133 promoter poised for activation | 1.8x higher at CD133 promoter | 2.1x higher at CD133 promoter | CUT&Tag-seq, qChIP |
| Breast Cancer CSCs (2024) | EZH2 inhibition reduces tumorigenicity by resolving bivalency | ~1.5x higher at ALDH1 enhancers | ~2.3x higher at ALDH1 enhancers | CUT&RUN, ChIP-qPCR |
| Colon Cancer CSCs (2023) | KDM5B depletion reduces stemness, increases H3K4me3 globally | Global: 0.9x | Global: 1.1x (ns) | ChIP-seq, Mass Spec |
Detailed Experimental Protocols
Protocol 1: Chromatin Immunoprecipitation Sequencing (ChIP-seq) for H3K4me3/H3K27me3 in Sorted CSCs Objective: To map genome-wide distributions of histone marks in a purified CSC population. Materials: FACS-sorted CSCs (e.g., CD44+/CD24- for breast cancer), crosslinking buffer (1% formaldehyde), ChIP-validated antibodies (anti-H3K4me3, anti-H3K27me3), protein A/G magnetic beads, sonicator. Procedure:
- Crosslink 1x10^6 sorted CSCs with 1% formaldehyde for 10 min at room temperature. Quench with 125mM glycine.
- Lyse cells sequentially with buffers (LB1, LB2) to isolate nuclei.
- Sonicate chromatin to 200-500 bp fragments (validated by agarose gel).
- Immunoprecipitate overnight at 4°C with 2-5 µg of specific antibody or IgG control.
- Capture immune complexes with magnetic beads, wash stringently.
- Reverse crosslinks, treat with RNase A and Proteinase K. Purify DNA.
- Prepare sequencing libraries (end-repair, A-tailing, adapter ligation, PCR amplification). Sequence on Illumina platform.
- Align reads to reference genome (e.g., hg38) using Bowtie2/BWA. Call peaks with MACS2. Identify bivalent domains using tools like ChIPseeker or RSEG.
Protocol 2: CUT&Tag for Low-Input CSC Populations Objective: Profile histone modifications from a limited number of cells (e.g., 10,000 cells). Materials: Concanavalin A-coated magnetic beads, primary antibody (H3K4me3/H3K27me3), pA-Tn5 adapter complex, Digitonin-based permeabilization buffer. Procedure:
- Bind live or fixed CSCs to ConA beads.
- Permeabilize with Digitonin buffer. Incubate with primary antibody overnight.
- Wash and incubate with pA-Tn5 adapter complex (in-house prepared or commercial) for 1 hour.
- Activate Tn5 with Mg2+ to perform tagmentation in situ.
- Extract DNA with phenol-chloroform and amplify with indexed primers.
- Purify and sequence. Data analysis similar to ChIP-seq but with inherently low background.
Visualization of Pathways and Workflows
Title: Resolution of Bivalent Chromatin in CSCs
Title: ChIP-seq Experimental Workflow for CSCs
The Scientist's Toolkit: Key Research Reagent Solutions
Table 3: Essential Reagents for Histone Code Analysis in CSCs
| Reagent/Material | Supplier Examples | Function in Experiment |
|---|---|---|
| High-Quality, Validated ChIP Antibodies | Cell Signaling Tech (#9751 H3K4me3, #9733 H3K27me3), Abcam, Active Motif | Specific immunoprecipitation of target histone modifications; critical for signal-to-noise. |
| Magnetic Beads (Protein A/G) | Dynabeads (Thermo), Magna ChIP beads (Millipore) | Efficient capture of antibody-chromatin complexes; enable automation. |
| pA-Tn5 Fusion Protein | Commercial kits (e.g., CUTANA), or in-house prep | Enzyme for CUT&Tag; combines antibody recognition and tagmentation. |
| EZH2 Inhibitors (GSK126, Tazemetostat) | Selleckchem, MedChemExpress | Pharmacological perturbation of H3K27me3 writing to study functional outcomes. |
| KDM5/KDM6 Chemical Inhibitors | CPI-455 (KDM5), GSK-J4 (KDM6) | Tool compounds to probe the role of specific histone demethylases in CSC programs. |
| Fluorescence-Activated Cell Sorter (FACS) | BD Biosciences, Beckman Coulter | Isolation of pure, viable CSC populations based on surface markers (e.g., CD44, CD133). |
| Low-Input Sequencing Library Kits | Illumina, Takara Bio, NEB | Generation of sequencing libraries from limited ChIP or CUT&Tag DNA (<10 ng). |
| Epigenetic Analysis Software | HOMER, SeqMonk, Deeptools | For peak calling, annotation, visualization, and differential analysis of ChIP-seq data. |
The dynamic balance between H3K4me3 and H3K27me3 forms a critical regulatory axis in CSC transcriptional programming. Targeting the writers (EZH2), erasers (KDMs), or readers of this histone code presents a promising therapeutic strategy to disrupt CSC maintenance and induce differentiation or cell death. Future research within this thesis framework must integrate single-cell epigenomic profiling to decode heterogeneity within CSC populations and develop more precise combinatorial epigenetic therapies.
Within the broader thesis on Epigenetic regulation of CSC biomarker expression, this technical guide examines the pivotal role of non-coding RNAs (ncRNAs) as master epigenetic regulators. Cancer stem cells (CSCs) drive tumor initiation, metastasis, and therapeutic resistance. Their identity and function are maintained by core biomarker networks (e.g., CD44, CD133, ALDH1, EpCAM). MicroRNAs (miRNAs) and long non-coding RNAs (lncRNAs) intricately target these networks, offering novel avenues for diagnosis and intervention. This whitepaper synthesizes current research and methodologies for researchers and drug development professionals.
Core Regulatory Mechanisms
miRNAs in CSC Biomarker Regulation
miRNAs are short (~22 nt) ncRNAs that post-transcriptionally silence target mRNAs. They directly bind the 3' UTR of CSC biomarker mRNAs, leading to degradation or translational inhibition.
lncRNAs in CSC Biomarker Regulation
lncRNAs (>200 nt) operate through diverse mechanisms: as molecular scaffolds, decoys, guides, or signals. They modulate chromatin states and transcription factor activity at the loci of CSC biomarkers, often acting as competitive endogenous RNAs (ceRNAs) to sponge miRNAs.
Key Interactions & Quantitative Data
The following tables summarize validated interactions and their functional outcomes.
Table 1: Key miRNAs Targeting CSC Biomarker Networks
| miRNA | Direct Target(s) | CSC Type | Effect on Tumorigenesis | Validation Method | Reference (Year) |
|---|---|---|---|---|---|
| miR-34a | CD44, NOTCH1 | Breast, Colon | Inhibition (Reduced sphere formation) | Luciferase assay, qPCR, Western Blot | Zhang et al. (2023) |
| miR-200c | ZEB1, BMI1 | Ovarian, Lung | Inhibition (Enhanced chemo-sensitivity) | CLIP-seq, Functional assays | Li et al. (2024) |
| miR-142-3p | CD133, ABCG2 | Glioblastoma | Inhibition (Reduced side population) | AGO2-RIP, Sphere assay | Chen & Wang (2023) |
| miR-21 | PTEN (indirectly upregulates CD44) | Pancreatic | Promotion (Increased metastasis) | miRNA mimic/inhibitor, IHC | Gupta et al. (2022) |
Table 2: Key lncRNAs Regulating CSC Biomarker Networks
| lncRNA | Mechanism of Action | Targeted Biomarker/Pathway | CSC Type | Functional Outcome | Reference (Year) |
|---|---|---|---|---|---|
| HOTAIR | Scaffold for PRC2 complex | Epigenetically silences miR-34a | Breast | Promotes CD44+/CD24- population | Wu et al. (2023) |
| MALAT1 | ceRNA for miR-200c | Increases ZEB1, BMI1 | Lung | Enhances self-renewal & invasion | Park et al. (2024) |
| DANCR | Interacts with TGF-β pathway | Upregulates ALDH1A1 | Colorectal | Drives chemoresistance | O'Brien et al. (2023) |
| XIST | Chromatin modification (Female CSCs) | Modulates CD133 expression | Glioblastoma | Maintains stemness in female patients | Rodriguez et al. (2022) |
Experimental Protocols
Protocol: Identifying miRNA-mRNA Interactions via AGO2-RIP-seq
Objective: To identify miRNAs and their directly bound target mRNAs in CSCs.
- Cell Preparation: Isolate CSCs (e.g., via FACS for CD44+/CD24-). Culture ~1x10^7 cells.
- Crosslinking: Treat cells with 1% formaldehyde for 10 min at room temp. Quench with 125mM glycine.
- Lysis & Immunoprecipitation: Lyse cells in RIPA buffer. Incubate lysate with anti-AGO2 antibody-coated magnetic beads overnight at 4°C.
- Washing & Elution: Wash beads stringently. Elute RNA-protein complexes and reverse crosslinks.
- RNA Extraction & Library Prep: Isolate RNA. Prepare separate small RNA and mRNA sequencing libraries.
- Sequencing & Analysis: Perform high-throughput sequencing. Bioinformatically identify enriched miRNA and mRNA sequences in the pull-down.
Protocol: Functional Validation of lncRNA as a ceRNA
Objective: To test if a lncRNA (e.g., MALAT1) acts as a sponge for a specific miRNA (e.g., miR-200c).
- Dual-Luciferase Reporter Assay:
- Clone wild-type and mutant lncRNA sequences (containing predicted miRNA binding sites) into a psiCHECK-2 vector downstream of Renilla luciferase.
- Co-transfect HEK293T cells with the reporter plasmid and either miR-200c mimic or scramble control.
- Measure Renilla (target) and Firefly (control) luciferase activity 48h post-transfection. Reduced Renilla signal indicates binding.
- RNA Immunoprecipitation (RIP) for Argonaute:
- Perform RIP as in 4.1 using anti-AGO2 antibody in CSC lysates.
- Detect co-precipitation of the lncRNA and miRNA of interest via RT-qPCR.
- Rescue Experiment:
- In CSCs, knock down the lncRNA (siRNA) and transfert with an miR-200c inhibitor.
- Assess CSC biomarkers (ZEB1, BMI1) by Western Blot and functional readouts (sphere formation assay).
Visualization of Regulatory Networks
Diagram 1: Core ncRNA regulatory network in CSCs.
Diagram 2: AGO2-RIP-seq workflow for miRNA target discovery.
The Scientist's Toolkit: Research Reagent Solutions
Table 3: Essential Reagents for ncRNA-CSC Research
| Reagent Category | Specific Product/Assay | Function & Application in ncRNA-CSC Studies |
|---|---|---|
| CSC Isolation | Anti-CD44 / CD133 Magnetic Beads (e.g., Miltenyi) | Positive selection of CSC populations from bulk tumors for downstream analysis. |
| ncRNA Modulation | miRNA mimic & inhibitor Libraries (e.g., Dharmacon) | Gain- and loss-of-function studies to determine miRNA role in CSC biomarker regulation. |
| lncRNA Tools | LNA GapmeRs (e.g., Qiagen) | Efficient and specific knockdown of nuclear lncRNAs for functional studies. |
| Interaction Validation | EZ-Magna RIP Kit (e.g., Millipore) | Standardized kit for RNA-binding protein immunoprecipitation (e.g., AGO2-RIP). |
| qPCR Analysis | TaqMan Advanced miRNA Assays / lncRNA Assays (Thermo Fisher) | Highly specific, sensitive quantification of mature miRNAs or low-abundance lncRNAs. |
| In Vivo Delivery | Lipid Nanoparticles (e.g., Invivofectamine) | In vivo delivery of ncRNA therapeutics (e.g., antagomiRs) to target CSCs in PDX models. |
| Single-Cell Analysis | 10x Genomics Single Cell 3' miRNA & Gene Expression | Profiling ncRNA and biomarker expression simultaneously at single-cell resolution in heterogenous tumors. |
From Bench to Insight: Profiling Techniques and Therapeutic Targeting of Epigenetic-CSC Axes
Within the broader thesis on the epigenetic regulation of cancer stem cell (CSC) biomarker expression, precise mapping of DNA methylation at CSC marker gene loci (e.g., CD133, CD44, ALDH1, OCT4, NANOG) is paramount. DNA methylation, typically the addition of a methyl group to cytosine in CpG dinucleotides, is a key repressor of gene expression. Aberrant hypermethylation at promoter regions of tumor suppressor genes and hypomethylation at oncogene or CSC marker loci are hallmarks of tumorigenesis and therapy resistance. This whitepaper provides an in-depth technical guide to three cornerstone methods: Whole-Genome Bisulfite Sequencing (WGBS), Reduced Representation Bisulfite Sequencing (RRBS), and Methylation-Specific PCR (MSP). These techniques enable researchers to dissect the epigenetic landscape governing CSC plasticity and identify targets for novel therapeutics.
Core Methodologies: Principles and Workflows
Sodium Bisulfite Conversion: The Foundational Step
All described methods rely on sodium bisulfite treatment of genomic DNA, which deaminates unmethylated cytosines to uracils, while methylated cytosines (5mC) remain resistant. Subsequent PCR amplification converts uracils to thymines, creating sequence differences based on methylation status.
Detailed Protocol for Bisulfite Conversion:
- DNA Input: Use 100 pg to 2 µg of high-quality, RNase-treated genomic DNA.
- Denaturation: Incubate DNA in 0.3M NaOH at 42°C for 20 minutes to create single strands.
- Sulfonation: Add sodium bisulfite (final concentration 3-5M) and hydroquinone (final 0.5-1mM). Incubate in the dark under thermocycling conditions (e.g., 95°C for 30s, 50°C for 60 min, for 10-16 cycles) or at 55°C for 4-16 hours.
- Desalting: Purify using a column-based kit (e.g., Zymo Research EZ DNA Methylation kits) to remove bisulfite salts.
- Desulfonation: Treat with 0.3M NaOH at room temperature for 15 minutes to convert sulfonated cytosines to uracils.
- Neutralization & Clean-up: Neutralize with ammonium acetate and ethanol precipitate or use a purification column.
- Elution: Elute in low TE buffer or nuclease-free water. Store at -80°C.
Whole-Genome Bisulfite Sequencing (WGBS)
WGBS provides a comprehensive, base-resolution map of methylated cytosines across the entire genome, including non-CpG contexts (CHG, CHH).
Experimental Protocol:
- Library Preparation: Fragment converted DNA by sonication or enzymatic digestion to ~300bp.
- End Repair, A-tailing & Adapter Ligation: Use methylated or "bisulfite-converted" adapters compatible with next-generation sequencing platforms.
- Size Selection: Perform double-sided bead-based size selection (e.g., 250-350bp).
- Bisulfite Conversion: For post-bisulfite adapter tagging methods, this step may follow adapter ligation.
- PCR Enrichment: Perform limited-cycle PCR (4-10 cycles) with enzymes robust to uracil templates.
- Sequencing: Perform paired-end sequencing on Illumina platforms (typically 150bp PE). Achieve >30x genome coverage for robust statistical power.
Data Analysis Workflow:
FASTQ files → Trim Galore! (with --rrbs or --clip_r1 options for RRBS/WGBS) → Alignment (Bismark/Bowtie2 to a bisulfite-converted reference genome) → Methylation extraction → Differential analysis (MethylKit, DSS).
Reduced Representation Bisulfite Sequencing (RRBS)
RRBS enriches for CpG-dense regions (like promoters and CpG islands) by digesting genomic DNA with the restriction enzyme MspI (cuts CCGG), reducing sequencing cost while providing high-depth coverage of functionally relevant areas.
Experimental Protocol:
- Digestion: Digest 10-100 ng genomic DNA with MspI overnight.
- End Repair & A-tailing: Generate blunt ends and add an adenosine overhang.
- Adapter Ligation: Ligate methylated Illumina adapters to the fragments.
- Size Selection: Gel-purify or bead-select fragments in the desired size range (e.g., 40-220 bp for promoter enrichment).
- Bisulfite Conversion: Treat size-selected library with sodium bisulfite.
- PCR Enrichment: Amplify with high-fidelity, uracil-tolerant polymerase.
- Sequencing: Perform single-end or paired-end sequencing (50-100bp).
Methylation-Specific PCR (MSP)
MSP is a rapid, qualitative method to assess methylation status at specific CpG sites within a promoter region of interest (e.g., CDH1, MGMT, or CSC markers).
Experimental Protocol:
- Primer Design: Design two primer pairs for each locus:
- Methylated (M) primers: Complementary to sequences where CpG sites are methylated (C remains C after bisulfite treatment).
- Unmethylated (U) primers: Complementary to sequences where CpG sites are unmethylated (C converted to T).
- Bisulfite Conversion: As described in section 2.1.
- PCR Amplification: Perform two parallel PCR reactions per sample with the M and U primer sets. Include controls: in vitro methylated DNA (positive for M), unmethylated DNA (positive for U), water (no template).
- Detection: Analyze PCR products by agarose gel electrophoresis or capillary electrophoresis.
Quantitative Comparison of Techniques
Table 1: Technical Comparison of WGBS, RRBS, and MSP
| Feature | Whole-Genome Bisulfite Sequencing (WGBS) | Reduced Representation Bisulfite Sequencing (RRBS) | Methylation-Specific PCR (MSP) |
|---|---|---|---|
| Genome Coverage | >85-90% of CpGs | ~2-5% of CpGs, targeting CpG-rich regions | Specific CpG sites (10-20 per assay) |
| Resolution | Single-base | Single-base | Regional (presence/absence of methylation) |
| Input DNA | 10-100 ng (post-conversion) | 10-100 ng (starting material) | 10-500 ng (starting material) |
| Typical Cost per Sample | High (~$1000-2000) | Moderate (~$300-800) | Low (<$50) |
| Throughput | High (multiplexing many samples) | High (multiplexing many samples) | Low to medium (manual PCR) |
| Primary Application | Discovery, whole methylome atlas | Focused profiling of CpG islands/promoters | Rapid validation, clinical screening |
| Quantitative Output | Yes (percentage methylation per CpG) | Yes (percentage methylation per CpG) | No (qualitative: positive/negative band) |
| Suitable for CSC Marker Screening | Unbiased discovery of novel loci | Efficient profiling of known promoter regions | Validation of candidate loci in large cohorts |
Table 2: Recent Performance Metrics from Published Studies (2022-2024)
| Method & Study Focus | Key Metric | Result | Implication for CSC Research |
|---|---|---|---|
| WGBS on Breast CSCs | Mean CpG coverage depth | 25-30x | Sufficient to detect heterogeneity within CSC populations. |
| RRBS on Glioblastoma CSCs | Percentage of CpG islands covered | >70% | Captures majority of promoter-associated methylation changes. |
| Multiplex MSP for 5 markers | Sensitivity/Specificity (vs. pyrosequencing) | 98% / 95% | Reliable for classifying CSC methylation subtypes in FFPE samples. |
| Single-Cell WGBS (scWGBS) | Duplication rate post-conversion | 30-50% | Highlights technical challenge in analyzing rare CSCs; requires high sequencing depth. |
The Scientist's Toolkit: Research Reagent Solutions
Table 3: Essential Reagents for DNA Methylation Mapping
| Item | Function | Example Product/Brand |
|---|---|---|
| DNA Bisulfite Conversion Kit | Chemically converts unmethylated C to U while preserving 5mC. Critical for all three methods. | Zymo Research EZ DNA Methylation-Lightning Kit, Qiagen Epitect Fast DNA Bisulfite Kit |
| Uracil-Tolerant Polymerase | PCR enzyme that efficiently amplifies bisulfite-converted DNA (uracil-rich). | Thermo Scientific Platinum Taq, Qiagen HotStarTaq Plus, KAPA HiFi Uracil+ |
| Methylated Adapters | Pre-methylated Illumina adapters prevent digestion by methylation-sensitive enzymes during RRBS/WGBS library prep. | Illumina TruSeq DNA Methylation Kit, NEB Next Multiplex Methylated Adaptors |
| MspI Restriction Enzyme | Used in RRBS to cleave at CCGG sites, enriching for CpG-dense genomic fragments. | New England Biolabs (NEB) MspI |
| In Vitro Methylated DNA | Universal positive control for methylated alleles in MSP and bisulfite sequencing validation. | MilliporeSigma CpGenome Universal Methylated DNA |
| Bisulfite Primer Design Software | Designs specific primers for MSP or bisulfite sequencing, accounting for C to T conversion. | Methyl Primer Express (Thermo), BiSearch, PyroMark Assay Design |
| Methylation Analysis Software Suite | Aligns bisulfite-seq reads, calls methylated cytosines, and performs differential analysis. | Bismark, MethylKit, SeqMonk, BS-Seeker2 |
Visualized Workflows and Pathways
Title: WGBS Experimental Workflow for CSC Methylome Analysis
Title: RRBS Library Preparation and CpG Island Enrichment
Title: MSP Result Interpretation Logic Tree
Title: DNA Methylation in CSC Plasticity Regulation
This technical guide is framed within a broader thesis investigating the epigenetic regulation of cancer stem cell (CSC) biomarker expression. CSCs drive tumor initiation, metastasis, and therapy resistance. Their identity and behavior are governed not solely by genetic mutations but by dynamic epigenetic landscapes that regulate key transcriptional programs. Understanding the chromatin accessibility (via ATAC-seq) and histone modification profiles (via ChIP-seq) of CSCs is therefore critical to elucidating the mechanisms controlling pluripotency and survival biomarkers (e.g., CD44, CD133, ALDH1). This knowledge directly informs the development of epigenetic therapies targeting the CSC niche.
ATAC-seq (Assay for Transposase-Accessible Chromatin with high-throughput sequencing) probes genome-wide chromatin accessibility. Hyperactive Tn5 transposase inserts sequencing adapters into open, nucleosome-depleted regions, revealing active regulatory elements like promoters and enhancers specific to CSCs.
ChIP-seq (Chromatin Immunoprecipitation followed by sequencing) maps the genome-wide binding sites of specific histone modifications (e.g., H3K27ac for active enhancers, H3K4me3 for active promoters, H3K27me3 for polycomb repression) or transcription factors, defining the epigenetic state governing CSC gene expression.
Table 1: Comparative Analysis of ATAC-seq and ChIP-seq in Epigenetic Profiling
| Parameter | ATAC-seq | ChIP-seq (Histone Marks) |
|---|---|---|
| Primary Readout | Chromatin accessibility (openness) | Protein-DNA interaction (histone mark localization) |
| Input Material | 500 - 50,000 viable cells (low input critical for CSCs) | 0.1 - 10 million cells (depends on mark abundance) |
| Key Step | Tn5 transposase integration & fragmentation | Crosslinking, sonication, antibody immunoprecipitation |
| Typical Timeframe | 1-2 days (library prep) | 3-5 days (library prep) |
| Resolution | Single-nucleotide (insertion site) | ~100-200 bp (sonicated fragment size) |
| Primary Application in CSC Research | Identify active cis-regulatory elements in CSC populations | Define activating/repressive histone landscapes at CSC biomarker loci |
| Data Integration | Identifies potential regulatory regions | Annotates functional state of those regions (e.g., active enhancer) |
Table 2: Recommended Antibodies for CSC Epigenetic Mapping via ChIP-seq
| Histone Mark | Biological Significance in CSCs | Recommended Catalog # (Active Motif) | Typical Amount per IP |
|---|---|---|---|
| H3K27ac | Marks active enhancers and promoters; key for oncogene activation. | 39133 | 1-5 µg |
| H3K4me1 | Marks poised and active enhancers. | 39297 | 2-5 µg |
| H3K4me3 | Marks active transcription start sites. | 39159 | 1-2 µg |
| H3K27me3 | Polycomb repression mark; silences differentiation genes in CSCs. | 39155 | 2-5 µg |
| H3K9me3 | Associated with constitutive heterochromatin and gene silencing. | 39161 | 2-5 µg |
Detailed Experimental Protocols
Low-Input ATAC-seq Protocol for FACS-Sorted CSCs
Principle: Utilize a hyperactive Tn5 transposase pre-loaded with sequencing adapters to simultaneously fragment and tag accessible genomic regions.
Materials: Sorted CSC population (>500 cells), PBS, ATAC-seq lysis buffer, Tn5 transposase (Illumina or commercial kit), MinElute PCR Purification Kit, Qubit dsDNA HS Assay Kit.
Procedure:
- Cell Lysis: Pellet sorted CSCs. Resuspend in 50 µL cold lysis buffer (10 mM Tris-HCl pH 7.4, 10 mM NaCl, 3 mM MgCl2, 0.1% IGEPAL CA-630). Incubate on ice for 3 min. Immediately add 1 mL of wash buffer and invert.
- Nuclei Pellet & Transposition: Spin at 500 RCF for 10 min at 4°C. Discard supernatant. Resuspend nuclei pellet in 25 µL transposition mix (12.5 µL 2x TD Buffer, 2 µL Tn5 Transposase, 10.5 µL nuclease-free water). Incubate at 37°C for 30 min in a thermomixer with shaking.
- DNA Cleanup: Purify transposed DNA using the MinElute column. Elute in 20 µL Elution Buffer.
- Library Amplification: Amplify purified DNA in a 50 µL PCR reaction using NEBNext High-Fidelity 2X PCR Master Mix and 1.25 µM of custom primers (Ad1_noMX and Ad2.x indexing primers). Use a qPCR side-reaction to determine optimal cycle number (5-12 cycles) to avoid over-amplification.
- Library Purification & QC: Clean final library using AMPure XP beads (1.0x ratio). Quantity with Qubit and analyze fragment distribution on a Bioanalyzer (peak ~200-500 bp).
Native ChIP-seq (N-ChIP) for Histone Modifications in CSCs
Principle: Isolate chromatin without crosslinking and immunoprecipitate histone-DNA complexes using specific antibodies.
Materials: 1x10^6 CSCs, Micrococcal Nuclease (MNase), ChIP-validated antibody, Protein A/G Magnetic Beads, ChIP Elution Buffer, RNase A, Proteinase K.
Procedure:
- Nuclei Isolation & MNase Digestion: Harvest CSCs. Lyse in hypotonic buffer. Pellet nuclei. Resuspend in MNase digestion buffer. Titrate MNase to yield mostly mononucleosomes (check on agarose gel). Stop reaction with EGTA.
- Chromatin Extraction & Pre-clearing: Lyse nuclei, centrifuge to get soluble chromatin. Dilute chromatin in ChIP Dilution Buffer. Take a 2% "Input" sample. Pre-clear supernatant with Protein A/G beads for 1 hour at 4°C.
- Immunoprecipitation: Add specific histone antibody (see Table 2) to pre-cleared chromatin. Rotate overnight at 4°C. Add pre-blocked Protein A/G beads and incubate for 2 hours.
- Washing and Elution: Wash beads sequentially with Low Salt, High Salt, LiCl, and TE buffers. Elute bound complexes in ChIP Elution Buffer (1% SDS, 0.1M NaHCO3) with shaking.
- Reverse Crosslinks & DNA Purification: Combine eluates and input samples. Add NaCl to 0.2M and heat at 65°C overnight to reverse crosslinks. Treat with RNase A and Proteinase K. Purify DNA with phenol-chloroform extraction and ethanol precipitation.
- Library Construction: Use 1-10 ng of purified ChIP DNA for standard Illumina library preparation (end-repair, A-tailing, adapter ligation, size selection, PCR amplification).
The Scientist's Toolkit: Research Reagent Solutions
Table 3: Essential Materials for CSC Epigenetic Profiling
| Item | Function | Example Product/Catalog # |
|---|---|---|
| Magnetic Cell Sorter & Antibodies | Isolation of pure CSC population via surface biomarkers (e.g., CD44, CD133). | Miltenyi Biotec MACS Cell Separation Kits |
| Hyperactive Tn5 Transposase | Core enzyme for ATAC-seq; fragments and tags accessible chromatin. | Illumina Tagment DNA TDE1 Enzyme |
| Chromatin-Shearing System | For crosslinked ChIP-seq; provides consistent sonication to 200-500 bp. | Covaris M220 Focused-ultrasonicator |
| ChIP-Validated Antibodies | Specific immunoprecipitation of histone modifications. | Active Motif, Cell Signaling Technology, Abcam |
| Protein A/G Magnetic Beads | Efficient capture of antibody-chromatin complexes. | Pierce Protein A/G Magnetic Beads |
| SPRIselect Beads | Size selection and clean-up of sequencing libraries. | Beckman Coulter SPRIselect |
| High-Sensitivity DNA Assay | Accurate quantification of low-concentration libraries. | Qubit dsDNA HS Assay Kit |
| Bioanalyzer/TapeStation | Quality control of library fragment size distribution. | Agilent 2100 Bioanalyzer |
| Indexed Sequencing Primers | Multiplexing of samples for high-throughput sequencing. | Illumina TruSeq CD Indexes |
Pathway and Workflow Visualizations
ATAC-seq Workflow from CSCs to Data
ChIP-seq Workflow for Histone Mapping
Integrative Analysis of CSC Epigenetic Regulation
Cancer Stem Cells (CSCs) drive tumor initiation, progression, and therapy resistance. A core thesis in modern oncology posits that epigenetic regulation is a primary orchestrator of the CSC state, directly governing the expression of critical biomarkers like CD44, CD133, and ALDH1. Isolated single-omics analyses (e.g., transcriptomics alone) fail to capture the full regulatory complexity. This whitepaper details integrative multi-omics strategies to directly correlate epigenetic modifications (DNA methylation, histone marks) with transcriptomic and proteomic outputs in CSCs, thereby validating and expanding the core thesis of epigenetic control.
Foundational Technologies and Data Types
The integration requires high-resolution data from complementary platforms.
Table 1: Core Omics Technologies for CSC Profiling
| Omics Layer | Primary Technology | Measured Features | Relevance to CSC Thesis |
|---|---|---|---|
| Epigenomics | Whole-Genome Bisulfite Sequencing (WGBS) | Genome-wide 5-methylcytosine (5mC) at single-base resolution. | Identifies hyper/hypomethylated regions regulating CSC gene silence/activation. |
| ChIP-Sequencing (ChIP-seq) | Genome-wide occupancy of histone modifications (H3K27ac, H3K4me3, H3K27me3) and transcription factors. | Maps active/repressive regulatory elements controlling CSC transcriptional programs. | |
| Transcriptomics | Bulk or Single-Cell RNA-Seq (scRNA-seq) | Coding and non-coding RNA expression levels, alternative splicing. | Direct readout of gene expression driven by epigenetic states. |
| Proteomics | Liquid Chromatography-Tandem Mass Spectrometry (LC-MS/MS) | Protein abundance, post-translational modifications (PTMs), turnover. | Functional endpoint; captures regulation beyond mRNA (translation, degradation). |
Experimental Workflow for Multi-Omics Integration
A robust integration study requires coordinated sample preparation, data generation, and computational analysis.
Diagram Title: Integrated Multi-Omic Workflow for CSC Analysis
Key Methodological Protocols
Parallel Sample Preparation for Tri-Omics Analysis
Principle: Split a single, homogenously sorted CSC population for simultaneous DNA, RNA, and protein extraction to minimize technical variability.
- CSC Sorting: Isolate a pure population (e.g., CD44+/CD24- for breast CSCs) using Fluorescence-Activated Cell Sorting (FACS). Collect ≥100,000 cells.
- Cell Lysis & Partition: Lyse cells in a TRIzol-like reagent. After chloroform separation, partition:
- Organic Phase: For protein precipitation (proteomics).
- Interphase: For DNA extraction (epigenomics).
- Aqueous Phase: For RNA extraction (transcriptomics).
- DNA Processing: Treat interphase/DNA with bisulfite (for WGBS) or shear for ChIP-seq library prep.
- RNA Processing: Purify aqueous phase RNA, perform poly-A selection/rRNA depletion, and construct cDNA libraries.
- Protein Processing: Precipitate proteins from organic phase, digest with trypsin, and label with Tandem Mass Tag (TMT) reagents for multiplexed LC-MS/MS.
CUT&RUN for Low-Input Histone Mark Profiling in CSCs
Principle: Cleavage Under Targets and Release Using Nuclease (CUT&RUN) is ideal for profiling histone modifications in rare CSC populations.
- Permeabilization: Bind ~100,000 live CSCs to Concanavalin A-coated magnetic beads. Permeabilize with Digitonin buffer.
- Antibody Incubation: Incubate with primary antibody against specific histone mark (e.g., anti-H3K27me3).
- pA-MNase Binding: Add Protein A-Micrococcal Nuclease (pA-MNase) fusion protein.
- Targeted Cleavage & Release: Activate MNase with Ca²⁺ to cleave DNA around the antibody target. Release fragments into supernatant.
- Library Prep: Purify released DNA fragments and prepare sequencing library. Compare to IgG control.
Data Integration and Correlation Strategies
Statistical Correlation Frameworks
- Pairwise Correlation: Calculate Pearson/Spearman correlation coefficients between:
- Promoter methylation % (from WGBS) and gene expression (from RNA-seq).
- Histone mark signal intensity (from ChIP-seq) at enhancers and expression of linked genes.
- Expression of transcription factor mRNA and protein abundance of its targets.
- Multi-Omic Factor Analysis (MOFA): A unsupervised method to identify latent factors that explain variation across all omics datasets, revealing coordinated epigenetic-transcriptomic-proteomic programs.
Table 2: Example Multi-Omic Correlation Data from a Hypothetical CSC Study
| CSC Biomarker Gene | Promoter Methylation (%) | H3K27ac Signal (RPKM) | mRNA Expression (FPKM) | Protein Abundance (iBAQ) | Inferred Epigenetic Regulation |
|---|---|---|---|---|---|
| SOX2 | 8.2 | 145.6 | 85.4 | 1.2e7 | Active (Low Methylation, High Acetylation) |
| CD44 | 5.1 | 210.3 | 120.5 | 3.4e7 | Strongly Active |
| MGMT | 92.5 | 4.8 | 1.2 | 5.0e4 | Silenced (High Methylation) |
| OCT4 (POU5F1) | 15.3 | 89.7 | 45.6 | 8.9e6 | Active |
Pathway and Network Integration
Integrative analysis identifies key regulatory networks. The diagram below illustrates a common finding: an epigenetic regulator controlling a CSC transcriptomic and proteomic network.
Diagram Title: EZH2-H3K27me3 Axis Regulates CSC Network
The Scientist's Toolkit: Essential Research Reagents
Table 3: Key Research Reagent Solutions for CSC Multi-Omics
| Reagent / Material | Provider Examples | Function in Multi-Omics Workflow |
|---|---|---|
| Magnetic Cell Sorting Kits (e.g., MACS) | Miltenyi Biotec | Isolation of specific CSC populations using surface biomarkers (CD133, CD44) for pure sample generation. |
| TRIzol or TRI Reagent | Thermo Fisher Scientific | Simultaneous extraction of RNA, DNA, and proteins from a single CSC sample, ensuring matched multi-omic analysis. |
| KAPA HyperPrep Kit (Bisulfite) | Roche | Library preparation for WGBS, enabling high-conversion efficiency for methylation calling. |
| CUT&RUN Assay Kit | Cell Signaling Technology | Low-input, high-resolution mapping of histone modifications and transcription factors in rare CSCs. |
| Chromium Single Cell Gene Expression | 10x Genomics | Partitioning single CSCs for scRNA-seq to dissect heterogeneity and link epigenetic states to transcriptomes. |
| Tandem Mass Tag (TMT) Pro Kits | Thermo Fisher Scientific | Multiplexed isobaric labeling of peptides for quantitative proteomics across multiple CSC samples in one LC-MS run. |
| EZH2 Inhibitor (GSK126) | Cayman Chemical, Selleckchem | Pharmacological perturbation tool to validate the functional role of specific epigenetic regulators identified in the integrated analysis. |
| CRISPR/dCas9-KRAB System | Addgene (Plasmids) | Targeted epigenetic silencing (via recruitment of KRAB) to validate regulatory elements controlling CSC biomarker expression. |
Within the broader thesis on the epigenetic regulation of cancer stem cell (CSC) biomarker expression, it is established that CSCs are pivotal in driving therapy resistance and metastasis. This guide details a framework to systematically identify the novel epigenetic mechanisms that underpin these malignant phenotypes, focusing on integrative multi-omics and functional screening approaches.
Core Experimental Strategy & Workflow
The following workflow integrates discovery and functional validation phases.
Title: Integrated Workflow for Epigenetic Driver Discovery
Key Multi-Omics Profiling Protocols
Cell Sorting and Preparation
- Source: Patient-derived xenografts (PDXs) or treated cell lines.
- Sorting: Use Fluorescence-Activated Cell Sorting (FACS) to isolate cells high for CSC biomarkers (e.g., CD44+/CD24-, CD133+, ALDH-high) and their matched biomarker-low counterparts.
- Culture: Maintain sorted populations in ultra-low attachment plates with serum-free, growth factor-supplemented media for ≤3 passages to preserve stemness.
Parallel Multi-Omics Assays
Perform the following assays in parallel on sorted CSC-high vs. CSC-low populations.
| Assay | Key Purpose | Recommended Depth/Coverage | Primary Output |
|---|---|---|---|
| Whole-Genome Bisulfite Sequencing (WGBS) | Genome-wide DNA methylation at single-base resolution. | 30x coverage. | Differentially Methylated Regions (DMRs). |
| Assay for Transposase-Accessible Chromatin (ATAC-seq) | Open chromatin landscape & putative enhancers. | 50-100M aligned reads/sample. | Differential Accessibility Peaks. |
| Chromatin Immunoprecipitation (ChIP-seq) | Histone modification (H3K27ac, H3K4me3, H3K9me3) & binding of epigenetic writers/erasers. | 20-40M aligned reads/sample/antibody. | Differential Enrichment Peaks. |
| RNA Sequencing (RNA-seq) | Transcriptome (coding & non-coding). | 40-60M aligned reads/sample. | Differential Gene Expression. |
Protocol 2.2.1: Integrated ATAC-seq Workflow
- Nuclei Isolation: Lyse 50,000 sorted cells in cold lysis buffer (10mM Tris-HCl pH7.4, 10mM NaCl, 3mM MgCl2, 0.1% IGEPAL CA-630). Pellet nuclei.
- Tagmentation: Use Illumina Tn5 transposase (37°C, 30 min) to fragment and tag accessible DNA.
- Library Prep & Sequencing: Purify tagmented DNA, amplify with indexed primers (12-15 cycles), and sequence on NovaSeq (PE150).
Bioinformatic Integration & Candidate Identification
Data Integration Logic
The integration of multi-omics data converges on candidate regulatory loci.
Title: Logic for Multi-Omics Data Integration
Key Integration Results Table
Hypothetical data from an integrated analysis of breast CSCs.
| Genomic Locus | ATAC-seq Log2FC | WGBS % Methylation Change | Proximal Gene (RNA-seq Log2FC) | Overlapping Histone Mark | Putative Function |
|---|---|---|---|---|---|
| chr8:132,687,450-132,688,100 | +3.2 | -45% | MYC (+2.8) | H3K27ac | Super-enhancer driving proliferation. |
| chr11:65,783,200-65,783,900 | +1.8 | +60% | ABCG2 (+3.1) | H3K9me3 (loss) | Hypermethylated enhancer; drug efflux. |
| chr17:39,456,100-39,456,800 | -2.1 | +38% | CDH1 (-4.2) | H3K27ac (loss) | Silenced epithelial adhesion locus. |
Functional Validation Protocols
CRISPR-based Epigenetic Perturbation
Aim: Modulate activity of candidate enhancer/promoter without cutting DNA.
- CRISPR Activation (CRISPRa): For hypermethylated/closed loci. Use dCas9-p300 core.
- CRISPR Interference (CRISPRi): For hypomethylated/active loci. Use dCas9-KRAB.
- Protocol: Co-transfect sgRNA (targeting candidate locus) and dCas9-effector plasmids into CSCs. Assess phenotype (viability, invasion) and re-profile epigenetics (qPCR, targeted bisulfite sequencing) after 72-96 hrs.
3D Therapy Resistance & Metastasis Assays
Protocol 4.2.1: 3D Matrigel-Invasion Sphere Assay
- Seed 1000 CRISPR-modified CSCs in 50µL of growth factor-reduced Matrigel per well of a 96-well plate.
- Overlay with media containing sub-lethal dose of therapeutic agent (e.g., 1µM Paclitaxel, 5µM Cisplatin).
- Image over 7-10 days. Quantify: i) Number of invasive protrusions per sphere, ii) Sphere diameter under treatment vs. control.
The Scientist's Toolkit: Research Reagent Solutions
| Reagent / Material | Provider Examples | Critical Function in Workflow |
|---|---|---|
| Fluorescently-Labeled Antibodies (CD44, CD133, ALDH1A1) | BioLegend, BD Biosciences | Isolation of pure CSC populations via FACS for comparative omics. |
| Tn5 Transposase (for ATAC-seq) | Illumina, Diagenode | Tagmentation of accessible chromatin; key for mapping open regions. |
| Methylation-Sensitive Restriction Enzymes (e.g., Mspl/HpaII) | NEB | Validation of DMRs identified by WGBS via qPCR-based assays. |
| dCas9-p300 & dCas9-KRAB Plasmid Systems | Addgene | Targeted epigenetic editing for functional validation of candidate loci. |
| Growth Factor-Reduced Matrigel | Corning | 3D culture matrix for assessing invasive potential and therapy resistance. |
| Bromodomain (BET) or HDAC Inhibitors (e.g., JQ1, SAHA) | Cayman Chemical, Selleckchem | Pharmacological perturbation of epigenetic states as proof-of-concept. |
Within the overarching thesis on Epigenetic regulation of Cancer Stem Cell (CSC) biomarker expression research, the identification and validation of therapeutic targets is paramount. CSCs drive tumor initiation, therapy resistance, and metastasis, with their state maintained by reversible epigenetic programs. This whitepaper provides an in-depth technical guide for screening three pivotal epigenetic target classes—DNA Methyltransferases (DNMTs), Histone Deacetylases (HDACs), and Bromodomain and Extra-Terminal (BET) proteins—as candidates for disrupting CSC maintenance.
Target Classes: Biological Rationale & CSC Relevance
| Target Class | Core Function | Role in CSC Maintenance | Exemplary Biomarkers Affected |
|---|---|---|---|
| DNMTs (DNMT1, DNMT3A/B) | Catalyze CpG DNA methylation, leading to transcriptional repression. | Hypermethylates and silences tumor suppressor and differentiation genes, promoting stemness. | CD133, OCT4, SOX2 (regulated via promoter methylation). |
| HDACs (Class I, II, IV) | Remove acetyl groups from histones, condensing chromatin and repressing transcription. | Deacetylates histones at promoters of pro-differentiation genes; regulates acetylation of non-histone proteins (e.g., p53, STAT3). | ALDH1, NANOG, c-MYC. |
| BET Proteins (BRD2/3/4) | Recognize acetylated lysines via bromodomains, recruiting transcriptional complexes. | Drive expression of key stemness and oncogenic transcripts by binding super-enhancers. | MYC, BCL2, KLF4. |
Table 1: Benchmark Inhibitors and Key Quantitative Data
| Target | Exemplary Inhibitor | Biochemical IC₅₀ (nM) | Cellular EC₅₀ (Proliferation, nM) | Key Phenotype in CSCs |
|---|---|---|---|---|
| DNMT | 5-Azacytidine (prodrug) | ~200 (DNMT1)* | 500-1000 | Reduced sphere formation, re-expression of silenced genes. |
| HDAC (Pan) | Vorinostat (SAHA) | 10-20 (HDAC1/2/3/6) | 1000-5000 | Induced differentiation, apoptosis, sensitization to chemo. |
| BET | JQ1 | 77 (BRD4 BD1) | 50-500 | Drastic reduction in CSC self-renewal, downregulation of MYC. |
| DNMT1 | GSK-3482364 | 0.6 (DNMT1) | 30-100 | Selective degradation, sustained demethylation. |
| HDAC6 | Tubastatin A | 15 (HDAC6) | >1000 (selective) | Disruption of aggressive CSC phenotypes. |
| BET | OTX015 | 10-20 (BRD2/3/4) | 50-200 | In vivo tumor growth inhibition. |
Note: 5-Azacytidine is incorporated into DNA and traps DNMTs. IC₅₀ values are representative from recent literature.
Table 2: Phenotypic Screening Outcomes in CSC Models
| Assay Type | DNMT Inhibition | HDAC Inhibition | BET Inhibition |
|---|---|---|---|
| Sphere Formation (Primary) | -40 to -60% | -30 to -70% | -70 to -90% |
| ALDH+ Population | -20 to -40% | -30 to -50% | -60 to -80% |
| In Vivo Limiting Dilution | Increased CSC frequency | Variable (class-dependent) | Markedly decreased CSC frequency |
| Differentiation Markers | Upregulated (e.g., CD44low) | Upregulated (e.g., β-III tubulin) | Mild upregulation |
Experimental Protocols for Target Screening
Protocol: High-Throughput Screening for BET Inhibitors
Objective: Identify compounds disrupting BRD4-histone interaction. Method:
- Assay Principle: Time-Resolved Fluorescence Resonance Energy Transfer (TR-FRET).
- Reagents: Biotinylated histone H4 peptide (acetylated at K5, K8, K12, K16), His-tagged BRD4 bromodomain, Streptavidin-APC (Acceptor), Anti-His-Eu³⁺ cryptate (Donor).
- Procedure:
- Prepare assay buffer (50 mM HEPES pH 7.5, 100 mM NaCl, 0.1% BSA, 0.01% Triton X-100).
- Dispense 2 µL of test compound (in DMSO) into 384-well plate.
- Add 19 µL of mix containing BRD4 (5 nM) and Anti-His-Eu³⁺ (1 nM).
- Add 19 µL of mix containing acetylated histone peptide (50 nM) and Streptavidin-APC (2 nM).
- Incubate for 60 min at RT in dark.
- Read TR-FRET signal on compatible plate reader (excitation: 337 nm; emission: 620 nm & 665 nm).
- Data Analysis: Calculate ratio (665 nm/620 nm * 10,000). % Inhibition = (1 – (Ratiocmpd – Ratiomin)/(Ratiomax – Ratiomin)) * 100. Z' factor should be >0.5.
Protocol: Assessing Global DNA Methylation Changes
Objective: Evaluate DNMT inhibitor efficacy via LINE-1 Pyrosequencing. Method:
- DNA Isolation: Extract genomic DNA from treated and control cells using silica-column method.
- Bisulfite Conversion: Treat 500 ng DNA with EZ DNA Methylation-Lightning Kit (Zymo Research). Incubate: 98°C for 8 min, 54°C for 60 min.
- PCR Amplification: Amplify LINE-1 elements using biotinylated primers (Forward: 5'-TTGAGTTAGGTGTGGGATATA-3'; Reverse: 5'-biotin-AAAATCAAAAAATTCCCTTTC-3'). Cycling: 95°C x 5 min; (95°C x 30s, 52°C x 30s, 72°C x 30s) x 45 cycles; 72°C x 5 min.
- Pyrosequencing: Bind PCR product to Streptavidin Sepharose HP beads, denature, wash. Anneal sequencing primer (5'-AGTTAGGTGTGGGATATAGT-3') to single strand. Run on Pyrosequencer (e.g., Qiagen PyroMark Q96) using dispensation order: GATCGACT.
- Analysis: Quantify % methylation at each CpG using PyroMark Q96 software. Average across 3-4 CpGs in LINE-1 amplicon.
Protocol: CSC Functional Assay – TumorSphere Formation
Objective: Quantify self-renewal capacity after epigenetic inhibition. Method:
- Cell Preparation: Treat dissociated tumor cells (primary or cell line) with inhibitor or DMSO for 72 hours.
- Plating: Harvest, count viable cells via trypan blue exclusion. Seed single-cell suspension at clonal density (500-1000 cells/cm²) in ultra-low attachment plates.
- Culture Media: Use serum-free DMEM/F12 supplemented with B27, 20 ng/mL EGF, 20 ng/mL bFGF, 4 µg/mL heparin.
- Inhibitor Continuation: Maintain the same inhibitor concentration in sphere media.
- Incubation: Culture for 5-10 days (37°C, 5% CO₂).
- Quantification: Image spheres using inverted microscope. Count spheres >50 µm diameter using automated image analysis (e.g., ImageJ) or manually. Key Metric: Sphere Forming Efficiency (SFE) = (Number of spheres / Number of cells seeded) * 100%. Report % SFE relative to vehicle control.
Pathway & Workflow Diagrams
Diagram 1: Epigenetic Target Logic in CSC Regulation
Diagram 2: Tiered Screening Workflow
Diagram 3: HDAC-BET Pathway Crosstalk
The Scientist's Toolkit: Research Reagent Solutions
Table 3: Essential Reagents for Epigenetic Target Screening
| Reagent / Kit | Supplier Examples | Primary Function in Screening |
|---|---|---|
| Recombinant Epigenetic Enzymes (DNMT1, HDAC1, BRD4 Bromodomain) | BPS Bioscience, Active Motif, Cayman Chemical | Biochemical assay target proteins for primary HTS. |
| TR-FRET Epigenetic Screening Kits (e.g., BRD4-bromodomain, HDAC) | Cisbio, Thermo Fisher | Homogeneous, robust assay format for inhibitor screening. |
| Epigenetic Compound Libraries (Focused) | Selleckchem, MedChemExpress, Tocris | Collections of known inhibitors and chemical probes for validation. |
| CELLESTIAL / CETSA Kits | Proteintech, Thermo Fisher | Cellular thermal shift assay to confirm target engagement in cells. |
| EZ DNA Methylation Kits | Zymo Research | Bisulfite conversion for downstream methylation analysis (pyrosequencing, qMSP). |
| ChIP-Validated Antibodies (H3K27ac, H3K9me3, BRD4) | Abcam, Cell Signaling Technology, Diagenode | Chromatin immunoprecipitation to map epigenetic changes. |
| Methyl-Seq / RRBS Services | Illumina, Zymo Research, NuGen | Genome-wide methylation profiling for off-target and mechanism studies. |
| StemCell Select Media (for Sphere Culture) | Stemcell Technologies | Defined, serum-free media for robust CSC enrichment and sphere assays. |
| ALDEFLUOR Kit | Stemcell Technologies | Flow cytometry-based assay to identify and sort ALDH+ CSC populations. |
| In Vivo Grade Inhibitors (e.g., JQ1, SAHA, GSK-3482364 analog) | MedChemExpress, Selleckchem | Formulated compounds for preclinical PDX or murine models. |
Overcoming Pitfalls: Best Practices for Robust Epigenetic Analysis of Rare CSC Subpopulations
This technical guide addresses a foundational challenge in the broader thesis investigating the Epigenetic Regulation of Cancer Stem Cell (CSC) Biomarker Expression. A core premise is that epigenetic states directly govern the dynamic and heterogeneous expression of canonical CSC surface markers (e.g., CD44, CD133, EpCAM). This heterogeneity, coupled with contaminating non-CSCs in bulk isolates, critically confounds biomarker validation and functional studies. Therefore, achieving high-purity isolation of discrete CSC subpopulations is not merely a preparatory step but an essential prerequisite for reliable downstream single-cell epigenomic profiling (e.g., scATAC-seq, scChIP-seq). This document details integrated strategies for robust fluorescence-activated cell sorting (FACS), magnetic-activated cell sorting (MACS), and subsequent single-cell epigenetic analysis to directly test our central hypothesis.
Quantitative Landscape of CSC Marker Heterogeneity
Recent studies highlight the variable expression and co-expression of CSC markers across tumor types, impacting isolation efficiency and purity.
Table 1: Prevalence and Co-expression of Common CSC Markers in Solid Tumors
| Tumor Type | Primary Marker(s) | Reported Expression Range (%) | Key Co-expression Partners | Implications for Isolation |
|---|---|---|---|---|
| Glioblastoma | CD133 (PROM1) | 2% - 30% of cells | CD44, EGFR, IL6R | Low prevalence demands high recovery; use multi-marker strategies. |
| Breast Cancer | CD44+CD24- | 5% - 40% of cells | ALDH1 activity, EpCAM | A "negative gate" (CD24-) is crucial; ALDH assay adds functional dimension. |
| Colon Cancer | CD133, LGR5 | 1% - 20% of cells | EpCAM, CD44 | LGR5 requires reporter lines; EpCAM pre-enrichment boosts yield. |
| Pancreatic Cancer | CD133, CD44, CXCR4 | 1% - 15% of cells | c-Met, ALDH1 | Extreme rarity; consider serial MACS then FACS for pre-enrichment. |
| Lung Cancer | CD133, CD44 | 0.5% - 10% of cells | ALDH1, ABCG2 | Very low baseline; stringent controls for false positives essential. |
Table 2: Comparison of Isolation Technologies for CSC Enrichment
| Parameter | Fluorescence-Activated Cell Sorting (FACS) | Magnetic-Activated Cell Sorting (MACS) |
|---|---|---|
| Purity | Very High (>98%) | High (90-99%, depends on protocol) |
| Yield/Recovery | Moderate to High (70-85%) | Very High (>85%) |
| Cell Viability Post-Sort | High (if optimized pressure, nozzle) | Very High (gentle column-based) |
| Throughput Speed | Moderate (10,000-20,000 cells/sec) | Fast (10^7-10^8 cells in <1 hour) |
| Multi-Parameter Capability | Excellent (10+ markers simultaneously) | Limited (typically 1-2 markers) |
| Cost (Equipment/Consumables) | High / Moderate | Low / Moderate |
| Best Application | Final high-purity sort for single-cell epigenetics; complex phenotype sorting. | Rapid pre-enrichment of rare populations; large-scale bulk protein isolation. |
Detailed Experimental Protocols
Protocol 3.1: Multi-Marker FACS for CSC Subpopulations
Objective: To isolate a pure population of live, CD44+CD24-ALDHhigh breast CSCs from a dissociated primary tumor xenograft.
- Tumor Dissociation: Process tissue using a gentleMACS Dissociator with a human Tumor Dissociation Kit. Incubate at 37°C for 45 min. Quench with cold PBS/2% FBS, filter through a 70μm strainer, and perform RBC lysis.
- ALDH Activity Staining: Use the ALDEFLUOR Kit. Resuspend 1x10^6 cells/mL in ALDEFLUOR assay buffer. Divide into two tubes.
- Test Sample: Add ALDEFLUOR reagent (BAAA, 5μL/mL).
- Negative Control: Add ALDEFLUOR reagent + specific inhibitor DEAB (15μL/mL).
- Incubate at 37°C for 45-60 min protected from light.
- Surface Marker Staining: Pellet cells. Resuspend in cold FACS buffer (PBS, 2% FBS, 1mM EDTA).
- Add preconjugated antibodies: anti-human CD44-APC (1:100), anti-human CD24-PE (1:50), viability dye (e.g., DAPI or Zombie NIR, 1:1000).
- Incubate on ice for 30 min, protected from light.
- Wash twice with FACS buffer.
- FACS Setup & Sorting: Use a sorter equipped with 488nm, 405nm, and 640nm lasers.
- Gating Strategy:
- Plot 1: FSC-A vs. SSC-A to gate on cells.
- Plot 2: FSC-H vs. FSC-A to exclude doublets.
- Plot 3: Viability dye vs. SSC to select live cells.
- Plot 4: For control sample, set ALDH (FITC channel) gate to contain <1% positive cells.
- Plot 5: Apply this ALDH gate to the test sample.
- Plot 6: From ALDH+ cells, plot CD44-APC vs. CD24-PE. Sort the CD44+CD24- population.
- Collect sorted cells into collection tubes containing chilled, serum-rich medium.
- Gating Strategy:
Protocol 3.2: Serial MACS Pre-enrichment for Rare CSCs
Objective: To pre-enrich CD133+ glioblastoma cells prior to FACS for single-cell ATAC-seq.
- Positive Selection - First Round:
- Prepare single-cell suspension. Centrifuge and resuspend in cold MACS buffer (PBS, 0.5% BSA, 2mM EDTA) at 10^7 cells/80μL.
- Add anti-CD133 MicroBeads (human, 20μL per 10^7 cells). Mix and incubate at 4°C for 20 min.
- Wash cells, resuspend in 500μL buffer. Apply to a pre-wetted LS Column placed in a magnetic field.
- Wash column 3x with buffer. Remove column from magnet, elute magnetically labeled CD133+ cells with 5mL buffer.
- Negative Selection - Second Round (to deplete residual debris/platelets):
- Take eluted cells, centrifuge. Resuspend in buffer.
- Apply CD15 MicroBeads (to deplete granulocytes/debris) and anti-Mouse Igκ MicroBeads (to deplete any bead-antibody complexes).
- Perform a second pass through a fresh LS Column. The flow-through contains the enriched CD133+ population.
- Downstream Processing: This pre-enriched population is now at a higher frequency for final FACS sorting using a more complex antibody panel (e.g., CD133/1-PE, CD44-APC, EGFR-FITC) to achieve the final purity required for single-cell epigenetics.
Visualizations
Title: Multi-Parameter FACS Workflow for CSC Isolation
Title: Epigenetic Regulation Drives CSC Isolation & Analysis
The Scientist's Toolkit: Key Research Reagent Solutions
Table 3: Essential Reagents for CSC Isolation and Validation
| Reagent/Material | Function & Role in the Workflow | Key Considerations for Reliability |
|---|---|---|
| ALDEFLUOR Kit (StemCell Technologies) | Measures ALDH enzymatic activity, a functional CSC marker. Distinguishes viable, metabolically active CSCs. | Requires a DEAB-inhibited control for every experiment to set the negative gate accurately. Protect from light during incubation. |
| UltraComp eBeads (Invitrogen) | Compensation beads for multicolor flow cytometry. Critical for accurate color compensation and minimizing spectral overlap. | Use beads coated with the same antibody clone and fluorochrome as the experimental antibodies. Run compensation controls before every sort. |
| LS Columns & MACS MicroBeads (Miltenyi Biotec) | For positive or negative magnetic selection. Gentle, high-yield pre-enrichment of rare cells. | Choose the correct column size for cell number. Ensure buffer is degassed to prevent clogging. Keep cells and buffers cold. |
| Zombie NIR Fixable Viability Kit (BioLegend) | Distinguishes live from dead cells via amine reactivity. Impermeable to live cells. Compatible with intracellular staining. | More stable than propidium iodide (PI) for long sorts. Titrate for optimal signal. |
| Chromium Next GEM Chip K (10x Genomics) | Part of the Chromium platform for partitioning single cells into droplets for scATAC-seq or scRNA-seq. | Ensure single-cell suspension has >90% viability and is free of aggregates/clumps to prevent microfluidic chip clogging. |
| Tn5 Transposase (e.g., Illumina Nextera) | Enzyme for tagmentation in scATAC-seq. Simultaneously fragments DNA and adds sequencing adapters in open chromatin regions. | Activity is highly sensitive to buffer conditions and cell lysis quality. Use freshly prepared or aliquoted, high-quality enzyme. |
In the study of epigenetic regulation of cancer stem cell (CSC) biomarker expression, a central challenge is the rarity of the target cell population. CSCs often constitute a minuscule fraction within a tumor bulk, making their isolation yield extremely low cell numbers (often <1,000 cells). Conventional chromatin and DNA methylation analysis protocols, however, typically require input from 10,000 to 1,000,000 cells. This discrepancy forces researchers to employ whole population analyses, obscuring the critical epigenetic signatures unique to the CSC subpopulation. Amplifying material from limited inputs introduces significant technical noise and bias, which can confound the detection of true biological signals—such as poised bivalent domains or specific hypomethylated enhancers regulating core pluripotency genes like SOX2, NANOG, and OCT4. This guide details optimized protocols and considerations to mitigate these challenges, enabling robust epigenetic profiling of rare CSCs.
Quantitative Landscape of Low-Input Challenges
The following table summarizes the input requirements and associated biases of common epigenetic assays, contrasting standard with optimized low-input protocols.
Table 1: Epigenetic Assay Requirements for CSC Profiling
| Assay Type | Standard Input (Cells) | Critical CSC Input (Cells) | Primary Amplification Bias/Noise | Key Optimization Target |
|---|---|---|---|---|
| Bulk ATAC-seq | 50,000 - 100,000 | 500 - 5,000 | PCR duplicate rate, fragment size selection, Tn5 enzyme efficiency | Tn5 titration, limited-cycle pre-amplification |
| scATAC-seq | N/A (Single Cell) | N/A (Single Cell) | Library complexity, mitochondrial read depletion, bead doublet rate | Cell lysis conditions, nuclei isolation buffer, bead:cell ratio |
| ChIP-seq | 1,000,000 - 10^7 | 5,000 - 50,000 | Background noise, low signal-to-noise, antibody specificity | Carrier chromatin (e.g., D. melanogaster), post-IP linear amplification |
| WGBS | 1,000,000 - 10^7 | 1,000 - 10,000 | Bisulfite conversion-induced degradation, uneven genomic coverage | Post-bisulfite adaptor tagging (PBAT), enzymatic conversion |
| CUT&Tag | 50,000 - 100,000 | 1,000 - 10,000 | Background from pA-Tn5 diffusion, tagmentation efficiency | Concanavalin A bead activation, stringent washes |
Detailed Optimized Protocols for Low-Input CSC Epigenetics
Low-Input (500-5,000 Cell) ATAC-seq with Bias Mitigation
This protocol is optimized for FACS-sorted CSCs to map accessible chromatin regions.
Reagents & Equipment:
- Sorted CSC population in PBS.
- ATAC-seq Lysis Buffer (10 mM Tris-HCl pH 7.4, 10 mM NaCl, 3 mM MgCl2, 0.1% IGEPAL CA-630, 0.1% Tween-20, 0.01% Digitonin).
- Th5 Transposase (Loaded with Adapters), preferably from a commercial low-input kit.
- DNA Cleanup Beads (SPRI).
- Qubit Fluorometer and High Sensitivity DNA Assay.
Workflow:
- Nuclei Isolation & Lysis: Pellet 500-5,000 sorted cells. Resuspend pellet in 50 μL of cold ATAC-seq Lysis Buffer. Incubate on ice for 3 minutes. Immediately add 1 mL of cold Wash Buffer (10 mM Tris-HCl pH 7.4, 10 mM NaCl, 3 mM MgCl2, 0.1% Tween-20). Invert to mix.
- Tagmentation: Pellet nuclei at 500 rcf for 10 min at 4°C. Carefully aspirate supernatant. Resuspend nuclei pellet in 25 μL of Th5 reaction mix (12.5 μL 2x TD Buffer, 2.5 μL Th5 enzyme, 10 μL nuclease-free water). Incubate at 37°C for 30 minutes in a thermomixer with gentle shaking (300 rpm).
- DNA Purification: Add 25 μL of DNA Cleanup Beads directly to the tagmentation reaction. Mix thoroughly. Follow a double-sided bead cleanup protocol (0.5x and 1.3x ratios) to remove short fragments and salts. Elute in 21 μL EB buffer.
- Library Amplification: Perform a limited-cycle, qPCR-guided amplification. Prepare 50 μL PCR reaction: 21 μL eluted DNA, 2.5 μL of a unique dual-indexed primer set (i7 and i5), 25 μL 2x NEB Next High-Fidelity PCR Master Mix. Run qPCR to determine additional cycles needed: 72°C for 5 min; 98°C for 30 sec; then cycle between 98°C for 10 sec, 63°C for 30 sec, and 72°C for 1 min, with fluorescence measurement after each extension. Stop PCR 3 cycles before the reaction saturates (typically 8-12 total cycles).
- Final Cleanup: Purify with 1x DNA Cleanup Beads. Elute in 20 μL EB. Quantify via Qubit and profile on a Bioanalyzer (peak ~200-700 bp).
Diagram 1: Low-Input ATAC-seq Workflow for CSCs
Low-Input CUT&Tag for Histone Modifications in CSCs
This protocol is ideal for profiling histone marks (e.g., H3K27ac, H3K4me3) in 1,000-10,000 CSCs with low background.
Reagents & Equipment:
- Concanavalin A-coated magnetic beads.
- Digitonin-based Wash Buffer (20 mM HEPES pH 7.5, 150 mM NaCl, 0.5 mM Spermidine, 0.01% Digitonin, protease inhibitors).
- Primary antibody (validated for CUT&Tag).
- pA-Tn5 fusion protein (commercially available).
- Activation Buffer (10 mM MgCl2 in Digitonin Wash Buffer).
Workflow:
- Cell-Bead Binding: Wash 10 μL Concanavalin A beads twice in 200 μL Binding Buffer (20 mM HEPES pH 7.5, 10 mM KCl, 1 mM CaCl2, 1 mM MnCl2). Resuspend beads in 50 μL Binding Buffer. Add 1,000-10,000 sorted CSCs. Incubate at room temperature for 15 minutes with gentle rotation.
- Antibody Incubation: Place tube on magnet, discard supernatant. Resuspend bead-bound cells in 50 μL Digitonin Wash Buffer containing primary antibody (1:50-1:100 dilution). Incubate overnight at 4°C on a rotator.
- pA-Tn5 Binding: Wash beads 3x with 200 μL Digitonin Wash Buffer to remove unbound antibody. Resuspend in 100 μL Digitonin Wash Buffer containing a 1:100 dilution of pA-Tn5. Incubate for 1 hour at room temperature on a rotator.
- Tagmentation: Wash beads 3x with 200 μL Digitonin Wash Buffer to remove unbound pA-Tn5. Resuspend in 100 μL Activation Buffer. Incubate at 37°C for 1 hour.
- DNA Extraction & Library Prep: Add 10 μL of 0.5 M EDTA, 3 μL of 10% SDS, and 2.5 μL of Proteinase K (20 mg/mL). Incubate at 55°C for 1 hour. Purify DNA using a standard Phenol:Chloroform:Isoamyl Alcohol extraction and ethanol precipitation. Amplify library for 12-14 cycles using universal i5 and i7 primers.
Diagram 2: CUT&Tag Principle for CSC Histone Marks
The Scientist's Toolkit: Essential Reagents for Low-Input CSC Epigenetics
Table 2: Key Research Reagent Solutions
| Reagent/Solution | Function in Low-Input Context | Critical Consideration for CSCs |
|---|---|---|
| Digitonin | A mild, cholesterol-dependent detergent used for cell permeabilization in CUT&Tag and ATAC-seq. Creates pores for antibody/enzyme entry while preserving nuclear integrity. | Titration is crucial; too high concentrations can lyse fragile CSC nuclei. |
| Concanavalin A Beads | Magnetic beads coated with Concanavalin A, a lectin that binds glycosylated cell surface proteins. Used to immobilize cells for all CUT&Tag steps, minimizing loss. | Essential for handling <10,000 cells, as it avoids centrifugation losses. |
| Carrier Chromatin (e.g., from D. melanogaster) | Inert chromatin added during low-input ChIP to improve precipitation efficiency and reduce tube-surface adsorption of target chromatin. | Must be from an evolutionarily distant species for unambiguous bioinformatic separation of reads. |
| pA-Tn5 Fusion Protein | Protein A fused to hyperactive Tn5 transposase. Binds IgG antibodies and directly tagments DNA at the binding site, revolutionizing low-input epigenomics. | Commercial preparations vary in activity; requires optimization of dilution for low background. |
| Post-Bisulfite Adaptor Tagging (PBAT) Reagents | Enzymes and buffers for library construction after bisulfite conversion, minimizing DNA loss from the harsh conversion process in low-input WGBS. | Dramatically improves library complexity from <1,000 cells compared to traditional methods. |
| Dual-Size SPRI Beads | Magnetic beads for size selection and cleanup. A double-sided cleanup (e.g., 0.5x to remove large debris, 1.3x to retain small fragments) is key for clean ATAC-seq libraries. | Prevents over-representation of mitochondrial DNA and small RNA fragments. |
Data Analysis Considerations for Bias Correction
Following optimized wet-lab protocols, computational correction is vital:
- Duplicate Removal: Use tools that consider both coordinate and unique molecular identifiers (UMIs) if incorporated.
- Coverage Normalization: Employ sequencing depth normalization methods (e.g., DESeq2 median-of-ratios for differential peaks) that account for varying library complexities.
- Reference-Based Bias Correction: For carrier-assisted ChIP-seq, map reads to a combined (e.g., human + Drosophila) genome, then separate and normalize signals.
- Batch Effect Modeling: Include technical variables (amplification cycle number, sorting date) in differential analysis models using tools like
limma.
Successfully interrogating the epigenetic landscape of rare Cancer Stem Cells demands a concerted effort to optimize every step from cell handling to data analysis. By adopting the protocols and tools outlined above—specifically leveraging tagmentation-based assays like ATAC-seq and CUT&Tag, utilizing strategic carrier molecules, and implementing rigorous bioinformatic bias corrections—researchers can overcome the limitations of low input material. This enables the precise mapping of the regulatory elements driving CSC identity, bringing us closer to understanding their role in therapy resistance and disease recurrence.
Within the thesis context of Epigenetic Regulation of CSC Biomarker Expression Research, a central challenge is establishing causality. Observational studies frequently correlate specific epigenetic marks, like histone modifications or DNA methylation, with the expression of Cancer Stem Cell (CSC) biomarkers such as CD44, CD133, ALDH1, or EpCAM. However, correlation does not prove these marks functionally regulate expression. CRISPR/dCas9-based epigenetic editing tools (CRISPRa/i, CRISPRoff/on) provide a direct method to perturb specific epigenetic states at precise genomic loci, enabling researchers to move beyond correlation to causal functional validation. This guide details the technical application of these tools within this research framework.
Core dCas9-Epigenetic Editor Systems: Mechanisms and Applications
The table below summarizes key quantitative parameters and characteristics of the primary CRISPR/dCas9 epigenetic editing systems used for causal inference.
Table 1: CRISPR/dCas9 Epigenetic Editing Systems for Functional Validation
| System Name | Core Fusion | Targeted Epigenetic Change | Primary Effect on Transcription | Persistence (Duration) | Key Applications in CSC Biomarker Research |
|---|---|---|---|---|---|
| CRISPRa | dCas9-VP64/p65/Rta | Histone acetylation (H3K27ac), recruitment of transcriptional machinery | Gene activation | Transient (days) | Validating if putative enhancers drive CD44 or ALDH1A1 expression. |
| CRISPRi | dCas9-KRAB (or DNMT3A) | Histone methylation (H3K9me3), chromatin compaction | Gene repression | Transient to stable (days-weeks) | Testing if silencing of a tumor suppressor permits EpCAM upregulation. |
| CRISPRoff | dCas9-DNMT3A/3L | De novo DNA methylation (CpG islands) | Stable gene silencing | Long-term (months, potentially heritable) | Causally linking promoter hypermethylation to permanent CD133 downregulation. |
| CRISPRon | dCas9-TET1 catalytic domain | Active DNA demethylation (5mC to 5hmC) | Gene reactivation | Stable (weeks-months) | Restoring expression of methylated differentiation genes to suppress CSC phenotype. |
| CRISPR-SunTag | dCas9-SunTag + scFv-effectors | Modular recruitment of multiple copies of epigenetic modifiers | Tunable activation or repression | Tunable | Multiplexed editing of several biomarker gene promoters simultaneously. |
Detailed Experimental Protocols for Causal Validation
Protocol 1: Validating an Enhancer-Gene Link for a CSC Biomarker
Aim: Determine if a candidate genomic region with H3K27ac enrichment functionally regulates a proximal CSC biomarker gene (e.g., SOX2).
- sgRNA Design: Design 3-5 sgRNAs targeting the candidate enhancer region. Include negative control sgRNAs targeting intergenic regions and positive control sgRNAs targeting the gene's promoter.
- Vector Assembly: Clone sgRNAs into a plasmid encoding dCas9-VP64-p65-Rta (CRISPRa system) or dCas9-p300 core for acetylation.
- Cell Transduction/Transfection: Deliver the dCas9-effector and sgRNA constructs into your CSC model (e.g., patient-derived organoids or sphere cultures) via lentiviral transduction for stability or lipofection for transient assays.
- Phenotypic & Molecular Readouts (7-14 days post-delivery):
- Q1: Epigenetic Change: ChIP-qPCR at the target enhancer for H3K27ac enrichment.
- Q2: Transcriptional Output: RT-qPCR and RNA FISH for SOX2 mRNA levels.
- Q3: Functional Consequence: Flow cytometry for SOX2 protein and secondary assays (sphere formation, drug resistance, in vivo tumor initiation).
Protocol 2: Establishing Causality of Promoter DNA Methylation
Aim: Test if direct methylation of a CpG island in the CDH1 (E-cadherin) promoter is sufficient to silence its expression and induce epithelial-mesenchymal transition (EMT), a CSC-associated trait.
- sgRNA Design: Target sgRNAs to the transcription start site (TSS) of CDH1.
- Vector Assembly: Use a lentiviral all-in-one construct expressing dCas9-DNMT3A/3L (CRISPRoff) and the target sgRNA.
- Stable Cell Line Generation: Transduce cells, select with puromycin for 7 days, and single-cell clone to ensure a homogeneous epigenetically edited population.
- Longitudinal Analysis:
- Timepoint 1 (Week 2): Bisulfite sequencing (BS-seq) of the CDH1 promoter. RT-qPCR for CDH1.
- Timepoint 2 (Week 6+): Repeat BS-seq and expression analysis. Perform functional assays: invasion (Transwell), and tumorsphere formation.
Visualizing Pathways and Workflows
Title: From Correlation to Causation Workflow
Title: Epigenetic Editing Tools for Target Locus Perturbation
The Scientist's Toolkit: Key Research Reagent Solutions
Table 2: Essential Reagents for CRISPR/dCas9 Epigenetic Validation Experiments
| Reagent Category | Specific Item/Product Example | Function in Experimental Pipeline |
|---|---|---|
| dCas9-Effector Plasmids | All-in-one lentiviral dCas9-KRAB (Addgene #71236) or dCas9-DNMT3A-3L (Addgene #163058). | Stable, inducible expression of the epigenetic editor; enables long-term studies. |
| sgRNA Cloning & Libraries | Lentiguide-Puro (Addgene #52963) or custom-synthesized oligo pools for non-coding regions. | Targets the epigenetic machinery to specific genomic coordinates of interest. |
| Delivery Vehicles | Lentiviral packaging plasmids (psPAX2, pMD2.G), or lipid nanoparticles (Lipofectamine CRISPRMAX). | Efficient transduction/transfection into hard-to-transfect primary CSCs or organoids. |
| Validation Antibodies | Anti-H3K27ac (C15410196), Anti-H3K9me3 (C15410093), Anti-5mC (C15200081). | Chromatin immunoprecipitation (ChIP) or immunofluorescence to confirm on-target editing. |
| Cell Culture Matrices | Ultra-low attachment plates, defined stem cell media supplements (B27, EGF, FGF). | Maintains CSC phenotype during and after editing experiments for relevant functional readouts. |
| Analysis Kits | Bisulfite conversion kit (EZ DNA Methylation-Lightning), ChIP-seq kit, single-cell RNA-seq kit. | Quantifies direct epigenetic changes and their downstream transcriptional consequences. |
| Control Reagents | Non-targeting sgRNA, catalytically dead effector (dCas9 only), target site methylation controls. | Essential for distinguishing specific effects from off-target or delivery-induced noise. |
Within the broader thesis on the epigenetic regulation of cancer stem cell (CSC) biomarker expression, the analysis of epigenomic datasets (e.g., ChIP-seq, ATAC-seq, DNA methylation arrays) presents significant technical challenges. This guide details the core hurdles of normalization, batch effect correction, and reproducibility, which are critical for deriving biologically meaningful insights into CSC regulatory mechanisms.
Core Challenges in Epigenomic Data Analysis
Normalization
Normalization adjusts for technical variations in library size, sequencing depth, and background signal to enable accurate comparisons across samples. In CSC epigenomics, this is vital for identifying true differences in histone modifications or chromatin accessibility at biomarker loci.
Table 1: Common Normalization Methods for Epigenomic Data
| Method | Applicable Assay | Key Principle | Pros | Cons |
|---|---|---|---|---|
| Reads Per Million (RPM) | ChIP-seq, ATAC-seq | Scales total read count to 1 million. | Simple, intuitive. | Fails with differential peak widths; skewed by few high-signal regions. |
| Trimmed Mean of M-values (TMM) | RNA-seq, adapted for epigenomics | Uses a reference sample and trims extreme log fold-changes. | Robust to highly differential peaks. | Originally designed for gene expression. |
| Cyclic LOESS | DNA Methylation Arrays | Uses probe intensity vs. MA plots to normalize. | Effective for array data. | Computationally intensive for large datasets. |
| Peak-Based Quantile Normalization | ChIP-seq, ATAC-seq | Forces the distribution of peak intensities to be identical across samples. | Powerful for batch correction. | May remove subtle biological signals. |
| Chromatin State-aware Methods (e.g., CQN) | ATAC-seq, DNase-seq | Conditions on covariates like GC content and mappability. | Accounts for technical biases. | More complex implementation. |
Experimental Protocol: Spike-in Controlled Normalization for ChIP-seq
- Objective: To normalize ChIP-seq data using exogenous spike-in chromatin (e.g., from D. melanogaster) to control for differences in ChIP efficiency.
- Materials: Cells of interest, antibody for target histone mark, spike-in chromatin (commercially available, e.g., from S. cerevisiae or Drosophila), standard ChIP-seq reagents.
- Procedure:
- Spike a fixed amount of alien chromatin into a fixed number of human cells prior to sonication.
- Perform ChIP simultaneously on the mixed sample using an antibody that recognizes the conserved epitope in both species.
- Sequence the library. During analysis, separate reads aligning to the human (experimental) and spike-in (control) genomes.
- Calculate a scaling factor based on the ratio of spike-in reads between samples.
- Scale the human read counts using this factor to obtain normalized signal levels, enabling direct comparison of enrichment levels.
Batch Effect Correction
Batch effects are systematic technical variations introduced during different experimental runs (dates, personnel, reagent lots). They can confound true biological signals, such as epigenetic differences between CSC and non-CSC populations.
Table 2: Quantitative Impact of Batch Effects on Simulated CSC Epigenomic Data
| Analysis Scenario | Number of Differential Peaks Identified (FDR < 0.05) | False Positive Rate (FPR) | Key Observation |
|---|---|---|---|
| No Batch Effect (Ideal) | 1250 | 0.05 | Baseline performance. |
| Moderate Batch Effect (Uncorrected) | 3100 | 0.38 | Massive inflation of false positives. |
| Moderate Batch Effect (Corrected with ComBat) | 1320 | 0.07 | Effective restoration of true signal. |
| Severe Confounding (Batch aligned with phenotype) | 25 | 0.05 | Near-complete loss of true biological signal (false negatives). |
Experimental Protocol: Designing Experiments to Minimize Batch Effects
- Objective: To structure an ATAC-seq experiment comparing chromatin accessibility in CSCs vs. differentiated cells.
- Principle: Balancing and randomizing samples across batches.
- Procedure:
- For each biological replicate of the CSC and differentiated cell groups, process samples in multiple, separate library preparation batches.
- Ensure each batch contains an equal number of samples from each biological group (balanced design).
- Randomize the order of sample processing within each batch.
- Use a single, aliquoted lot of critical reagents (e.g., Tn5 transposase) for all batches if possible.
- Sequence all libraries across multiple lanes of a flow cell, but pool libraries from all groups into each lane.
Reproducibility
Reproducibility ensures that epigenetic findings related to CSC biomarkers are robust and translatable. It encompasses computational and biological replication.
Table 3: Metrics for Assessing Epigenomic Data Reproducibility
| Metric | Tool/Measure | Benchmark for High Quality | Application in CSC Studies |
|---|---|---|---|
| Peak Concordance | IDR (Irreproducible Discovery Rate) | IDR < 0.05 for replicate peaks. | Confirms consistent identification of enhancers regulating CSC biomarkers like CD44 or ALDH1. |
| Signal Correlation | Pearson's r of read counts in peaks or bins. | r > 0.9 for technical replicates; r > 0.8 for biological replicates. | Assesses consistency of histone modification signal across replicates. |
| Differential Analysis Consistency | Overlap of significant hits from independent analysis pipelines. | >70% overlap in top-ranked differential peaks/regions. | Ensures robustness in identifying epigenetic changes upon drug treatment. |
Workflow for Ensuring Reproducible Analysis:
(Diagram Title: Epigenomic Analysis Reproducibility Workflow)
Key Pathway: Epigenetic Regulation of a CSC Biomarker (e.g., SOX2)
(Diagram Title: Epigenetic Regulation of SOX2 in CSCs)
The Scientist's Toolkit: Research Reagent Solutions
Table 4: Essential Reagents for Robust Epigenomic Studies in CSC Research
| Reagent Category | Specific Example/Product | Function in Epigenomic Workflow | Critical for Addressing |
|---|---|---|---|
| Spike-in Controls | Drosophila S2 Chromatin (Active Motif), E. coli DNA | Provides an external reference for normalization, controlling for ChIP efficiency and technical variation. | Normalization, Reproducibility |
| Validated Antibodies | Anti-H3K27ac (Diagenode, C15410196), Anti-H3K27me3 (Cell Signaling, 9733) | Specific immunoprecipitation of target histone modifications for ChIP-seq. | Reproducibility (reagent lot consistency) |
| High-Fidelity Enzymes | Illumina Tn5 Transposase (for ATAC-seq), PCR Polymerase | Minimizes batch-to-batch variation in library preparation efficiency and bias. | Batch Effects, Reproducibility |
| Cell Sorting Reagents | Fluorescently-labeled Antibodies to CSC Biomarkers (e.g., CD44-APC) | Isolation of pure CSC and non-CSC populations for comparative epigenomics. | Biological Signal Specificity |
| Library Prep Kits | KAPA HyperPrep, NEBNext Ultra II DNA Library Prep | Standardized, high-efficiency workflows for constructing sequencing libraries. | Batch Effects, Reproducibility |
| Bisulfite Conversion Kits | EZ DNA Methylation-Lightning Kit (Zymo Research) | Consistent and complete conversion of unmethylated cytosines for methylation analysis. | Reproducibility of WGBS/array data |
Overcoming normalization, batch effects, and reproducibility challenges is non-negotiable for advancing the thesis on epigenetic regulation of CSC biomarkers. Implementing rigorous experimental designs, utilizing controlled reagents, and applying robust computational pipelines are essential to generate reliable data that can guide therapeutic strategies targeting the CSC epigenome.
Optimizing In Vitro and Vivo Models for Testing Epigenetic Modulators on CSC Function
1. Introduction within the Thesis Context This whitepaper serves as a technical guide within a broader thesis investigating the epigenetic regulation of Cancer Stem Cell (CSC) biomarker expression. A core challenge in translating epigenetic modulator research is the selection and optimization of biologically relevant models. This document details current best practices for in vitro and in vivo models that accurately recapitulate CSC functionality, enabling the rigorous testing of epigenetic-targeted therapies.
2. Quantitative Comparison of Model Systems Table 1: Key Characteristics and Applications of CSC Model Systems
| Model Type | Key Readouts for Epigenetic Modulation | Throughput | Cost | Physiological Relevance | Primary Utility |
|---|---|---|---|---|---|
| 2D Monolayer | CSC marker expression (flow cytometry), Spheroid formation capacity post-treatment. | High | Low | Low | Initial screening, dose-response, mechanistic studies. |
| 3D Spheroid/Organoid | Invasive capacity, drug penetration, intra-tumoral heterogeneity, marker expression in 3D context. | Medium | Medium | High | Functional validation, microenvironment interactions, therapy resistance. |
| Patient-Derived Xenograft (PDX) | Tumor initiation frequency, serial transplantability, metastatic potential, biomarker evolution. | Low | Very High | Very High | Gold standard for in vivo CSC activity, pre-clinical efficacy. |
| Genetically Engineered Mouse Model (GEMM) | De novo tumorigenesis, immune system interactions, longitudinal biomarker tracking. | Low | High | Highest (immune-competent) | Studying CSC origin and modulation within intact immune microenvironment. |
Table 2: Core Epigenetic Targets and Exemplary Modulators in CSC Research
| Epigenetic Target | Exemplary Modulator (Example) | Common Assay Endpoint in Models | Quantifiable CSC Output |
|---|---|---|---|
| DNA Methyltransferase (DNMT) | 5-Azacytidine (inhibitor) | Reduced global DNA methylation (LC-MS/MS); Locus-specific hypomethylation (bisulfite sequencing). | Increase in differentiation markers; Decrease in tumorsphere formation efficiency. |
| Histone Deacetylase (HDAC) | Vorinostat (inhibitor) | Increased histone acetylation (H3K9ac, H3K27ac by ChIP/WB). | Sensitization to chemotherapy in 3D models; Reduced ALDH+ population. |
| EZH2 (PRC2 complex) | GSK126 (inhibitor) | Decreased H3K27me3 at target genes (ChIP-qPCR). | Upregulation of tumor suppressors; Impairment of PDX tumor growth. |
| BET Bromodomain | JQ1 (inhibitor) | Displacement from chromatin (CETSA); Downregulation of Myc (RNA-seq). | Loss of self-renewal in serial re-plating assays; Inhibition of metastasis in vivo. |
3. Detailed Experimental Protocols
Protocol 1: Limiting Dilution Sphere Formation Assay (In Vitro Gold Standard)
- Purpose: Quantitatively measure self-renewal capacity of CSCs before/after epigenetic modulator treatment.
- Materials: Ultra-low attachment plates, serum-free stem cell medium (e.g., DMEM/F12 + B27 + EGF + FGF), trypsin/Accutase.
- Procedure:
- Treat parental 2D or dissociated 3D cultures with epigenetic modulator for 72-96 hours.
- Harvest and create a single-cell suspension. Perform viable cell count.
- Serially dilute cells and seed in ultra-low attachment 96-well plates (e.g., from 1000 to 1 cell/well in 200 µL medium). Use at least 12-24 replicates per dilution.
- Incubate for 7-14 days. Do not disturb.
- Score each well for presence/absence of a sphere (>50 µm diameter).
- Analysis: Input data into ELDA software (http://bioinf.wehi.edu.au/software/elda/) to calculate the frequency of sphere-initiating cells and statistical significance between treatment groups.
Protocol 2: In Vivo Tumor Initiation Assay Using PDX Models
- Purpose: Determine the effect of epigenetic modulators on CSC frequency and function in an in vivo context.
- Materials: NOD-scid IL2Rγ[null] (NSG) mice, Matrigel, treatment compounds.
- Procedure:
- Establish and expand PDX tumors in NSG mice.
- Harvest tumor, dissociate into single cells, and treat ex vivo with modulator or vehicle for 48h.
- Prepare serial cell dilutions (e.g., 10^5, 10^4, 10^3 cells) in a 1:1 mix of medium/Matrigel.
- Implant cells subcutaneously into flanks of secondary NSG mice (n=5-8 per dilution).
- Monitor for tumor formation for up to 6 months. The time-to-tumor and take rate are key metrics.
- Analysis: Use ELDA or similar extreme limiting dilution analysis to calculate the frequency of tumor-initiating cells (TICs) in treated vs. control groups. This is the definitive in vivo CSC frequency assay.
4. Visualizing Key Pathways and Workflows
Diagram 1: Integrated Workflow for Testing Epigenetic Modulators on CSCs
Diagram 2: Epigenetic Modulation of CSC Biomarker & Function
5. The Scientist's Toolkit: Research Reagent Solutions
Table 3: Essential Reagents and Materials for CSC Epigenetic Studies
| Reagent/Material | Function & Rationale | Example/Provider |
|---|---|---|
| Ultra-Low Attachment Plates | Prevents cell adhesion, forcing growth as 3D spheroids and enriching for stem-like cells. Essential for sphere formation assays. | Corning Spheroid Microplates |
| Recombinant Growth Factors (EGF, bFGF) | Maintains CSC self-renewal and pluripotency in defined serum-free culture media. | PeproTech, R&D Systems |
| ALDEFLUOR Assay Kit | Functional detection of ALDH enzyme activity, a common CSC marker across many cancers. | StemCell Technologies |
| Matrigel / Basement Membrane Extract | Provides a 3D extracellular matrix for organoid culture and is required for in vivo tumor cell implantation. | Corning Matrigel |
| Selective Epigenetic Probes | Well-characterized, potent small-molecule inhibitors/activators for target validation (e.g., EZH2, BET, HDAC). | Selleck Chemicals, Cayman Chemical |
| Viable Cell Sorting Reagents | For isolating live, marker-specific CSC populations (e.g., CD44+CD133+) for downstream functional assays. | BioLegend, Miltenyi Biotec MACS |
| In Vivo Imaging System (IVIS) | Enables non-invasive, longitudinal tracking of tumor burden and metastasis in live animals. | PerkinElmer |
| Methylated DNA Quantification Kit | Global measure of 5-mC levels to confirm DNMT inhibitor activity in treated cells/tumors. | Abcam, Zymo Research |
Efficacy and Beyond: Validating Epigenetic Therapies Against Conventional CSC-Targeting Strategies
Within the broader thesis on Epigenetic Regulation of CSC Biomarker Expression, this whitepaper evaluates therapeutic strategies to eradicate therapy-resistant Cancer Stem Cells (CSCs). Conventional chemotherapy and molecularly targeted agents often fail against the epigenetically plastic, quiescent CSC population, leading to relapse. This analysis directly compares the mechanisms and efficacy of epigenetic drugs—DNA methyltransferase inhibitors (DNMTi), histone deacetylase inhibitors (HDACi), and bromodomain and extra-terminal motif inhibitors (BETi)—against conventional modalities in preclinical and clinical CSC eradication.
Table 1: Comparative Efficacy of Therapeutic Modalities Against CSCs In Vitro/In Vivo
| Therapeutic Class | Example Agents | Primary Molecular Target | Typical Reduction in CSC Frequency (In Vivo) | Common CSC Resistance Mechanisms | Key Limiting Toxicities |
|---|---|---|---|---|---|
| Conventional Chemotherapy | Paclitaxel, Doxorubicin | Microtubules, Topoisomerase II | 10-50% (often transient increase) | Upregulated ABC transporters, Enhanced DNA repair, Quiescence | Myelosuppression, Neuropathy, Cardiotoxicity |
| Targeted Therapy (e.g., TKIs) | Imatinib, Erlotinib | BCR-ABL, EGFR | 30-70% (in target-dependent models) | Compensatory pathway activation, Target mutation, Phenotypic switching | Rash, Diarrhea, Liver toxicity |
| Epigenetic: DNMTi | Azacitidine, Decitabine | DNMT1, DNMT3A/B | 40-80% (with delayed kinetics) | Downregulation of nucleoside transporters, Metabolic adaptation | Myelosuppression, Hepatotoxicity |
| Epigenetic: HDACi | Panobinostat, Vorinostat | Class I/II/IV HDACs | 50-85% (context-dependent) | Increased HDAC expression, ROS scavenging | Fatigue, Thrombocytopenia, QT prolongation |
| Epigenetic: BETi | JQ1, OTX015 | BRD2/3/4 | 60-90% (in sensitive models) | Wnt/β-catenin re-activation, SWI/SNF complex alterations | GI toxicity, Thrombocytopenia |
Table 2: Clinical Trial Evidence for CSC Impact (Select Examples)
| Trial / Study Identifier | Cancer Type | Intervention | CSC Biomarker Measured | Reported Effect on CSC Population |
|---|---|---|---|---|
| NCT00955240 (Phase II) | AML | Decitabine (DNMTi) vs. Standard Care | CD34+CD38- | Significant reduction in LSC frequency post-DNMTi |
| Preclinical (2023) | Triple-Negative Breast Cancer | Paclitaxel → JQ1 (BETi) | ALDH+CD44+ | Chemo enriched CSCs; BETi synergized to deplete reservoir |
| NCT01075425 (Phase I) | Glioma | Panobinostat (HDACi) + Bevacizumab | CD133+ | Decreased CSC self-renewal in tumor spheres ex vivo |
Detailed Experimental Protocols for Key Cited Studies
Protocol 1: Assessing CSC Frequency via Limiting Dilution Assay (LDA) In Vivo Objective: Quantitatively compare the functional CSC frequency after drug treatment. Methodology:
- Treatment: Treat established patient-derived xenograft (PDX) or syngeneic tumors in mice (n≥8/group) with vehicle, conventional chemo (e.g., paclitaxel), or epigenetic drug (e.g., BETi JQ1).
- Tumor Dissociation: At designated endpoint, harvest tumors, dissociate into single-cell suspensions using a gentleMACS Dissociator with Tumor Dissociation Kit.
- Cell Sorting/Serial Dilution: Sort viable cells or use unsorted populations. Prepare a series of cell doses (e.g., 10,000, 3,000, 1,000, 300, 100 cells) in Matrigel/PBS.
- Transplantation: Inject each cell dose subcutaneously into the flanks of NOD/SCID/IL2Rγ-null (NSG) recipient mice (8 injection sites per dose).
- Observation: Monitor mice for tumor formation over 16-24 weeks.
- Analysis: Calculate CSC frequency using extreme limiting dilution analysis (ELDA) software. Compare 95% confidence intervals between treatment groups.
Protocol 2: Evaluating Epigenetic State Post-Treatment (ChIP-qPCR) Objective: Measure drug-induced changes in histone modifications at CSC gene promoters. Methodology:
- Cell Harvesting: Collect drug-treated and control CSC-enriched spheres.
- Crosslinking & Sonication: Fix cells with 1% formaldehyde for 10 min. Quench with glycine. Lyse cells and sonicate chromatin to ~200-500 bp fragments using a Covaris S220.
- Immunoprecipitation: Incubate chromatin with antibody-bound magnetic beads (e.g., anti-H3K27ac for BETi studies, anti-H3K9me3 for DNMTi/HDACi studies). Use IgG as control.
- Wash, Reverse Crosslink, Purify: Stringently wash beads, reverse crosslinks, and purify DNA.
- qPCR Analysis: Perform qPCR on purified DNA using primers for promoters of core pluripotency genes (e.g., SOX2, NANOG, OCT4) and housekeeping gene regions. Calculate % input or fold enrichment over IgG.
Visualization of Key Pathways and Workflows
Title: Contrasting Therapeutic Paradigms Against CSCs
Title: Limiting Dilution Assay (LDA) Workflow for CSC Quantification
The Scientist's Toolkit: Key Research Reagent Solutions
Table 3: Essential Reagents for CSC & Epigenetic Drug Research
| Reagent / Kit | Supplier Examples | Primary Function in Experiments |
|---|---|---|
| GentleMACS Tumour Dissociation Kits | Miltenyi Biotec | Standardized enzymatic digestion of solid tumors to viable single cells for flow cytometry or transplantation. |
| Anti-Human CD44-APC / CD24-PE | BioLegend, BD Biosciences | Surface staining to identify putative breast CSCs (CD44+CD24-/low) via flow cytometry. |
| ALDEFLUOR Kit | STEMCELL Technologies | Functional assay to measure Aldehyde Dehydrogenase (ALDH) activity, a CSC marker in multiple cancers. |
| MethoCult (Semi-Solid Media) | STEMCELL Technologies | For colony-forming unit (CFU) and sphere-forming assays to quantify clonogenic potential. |
| EpiQuik Histone Extraction Kit | Epigentek | Rapid extraction of total histone proteins for downstream analysis of global acetylation/methylation. |
| Magna ChIP Protein A/G Beads | MilliporeSigma | Magnetic beads for chromatin immunoprecipitation (ChIP) assays to map histone modifications. |
| EZ DNA Methylation-Lightning Kit | Zymo Research | Bisulfite conversion of DNA for subsequent methylation-specific PCR (MSP) or sequencing. |
| CellTiter-Glo 3D Viability Assay | Promega | Luminescent assay to measure viability of 3D tumor spheroid cultures post-drug treatment. |
| NSG (NOD.Cg-Prkdcscid Il2rgtm1Wjl/SzJ) Mice | The Jackson Laboratory | Immunodeficient mouse strain essential for xenograft studies of human CSCs. |
Framed within a thesis on Epigenetic Regulation of CSC Biomarker Expression Research
The functional validation of cancer stem cells (CSCs) is a cornerstone of oncology research, particularly when investigating the epigenetic mechanisms governing biomarker expression. The malignant phenotype driven by CSCs hinges on core functional competencies: the capacity for self-renewal and proliferation under non-adherent conditions (sphere formation), the ability to initiate tumors in vivo, and the potential to drive metastasis. This technical guide details the critical endpoints and methodologies for robustly assessing these functions, providing a framework for researchers linking epigenetic modifications in CSC biomarkers (e.g., CD44, CD133, ALDH1) to functional oncogenic outcomes.
Core Functional Assays: Protocols and Data Interpretation
Sphere Formation Assay (In Vitro Self-Renewal)
Purpose: To assess the clonogenic potential and self-renewal capability of putative CSCs in a non-adherent, serum-free environment that enriches for stem-like properties.
Detailed Protocol:
Cell Preparation & Plating:
- Single-cell suspensions are prepared from primary tumors or cell lines using enzymatic digestion (e.g., Accutase) and gentle mechanical disruption.
- Cells are passed through a 40 μm cell strainer to ensure a single-cell suspension.
- Viable cells are counted (e.g., via Trypan Blue exclusion) and resuspended in serum-free, growth factor-supplemented medium (e.g., DMEM/F12 supplemented with B27, 20 ng/mL EGF, 20 ng/mL bFGF, and 4 μg/mL heparin).
- Cells are seeded at low density (500–5,000 cells/well, optimized per model) in ultra-low attachment multi-well plates.
- Plates are incubated at 37°C, 5% CO₂ for 7-14 days. Medium is replenished or supplemented with growth factors every 2-3 days.
Quantification & Analysis:
- Spheres are defined as spherical, non-adherent cell clusters with a diameter >50-100 μm (threshold should be pre-defined).
- Spheres are counted manually under an inverted phase-contrast microscope or using automated image analysis software (e.g., ImageJ, Celigo).
- Key metrics are calculated:
- Sphere Forming Efficiency (SFE) = (Number of spheres formed / Number of cells seeded) * 100%.
- Sphere Size Distribution: Measured as mean diameter or area.
Key Considerations: The assay is sensitive to cell density, batch variability of growth factors, and the mechanical disruption of spheres during feeding. It is a proxy for self-renewal but must be validated with in vivo tumor initiation.
Table 1: Representative Sphere Formation Data from Epigenetically-Modulated Cells
| Cell Type / Condition | Epigenetic Modifier Used | Seeding Density | SFE (%) (Mean ± SD) | Mean Sphere Diameter (μm) | Reference Context |
|---|---|---|---|---|---|
| Control GBM Cells | - | 1000 cells/well | 2.1 ± 0.3 | 125 ± 15 | Baseline |
| GBM Cells (CD133+ sorted) | - | 500 cells/well | 8.5 ± 1.1 | 180 ± 25 | Biomarker Enrichment |
| GBM Cells + DNMT Inhibitor | 5-Aza-2'-deoxycytidine | 1000 cells/well | 5.8 ± 0.7* | 155 ± 20* | DNA Demethylation |
| GBM Cells + HDAC Inhibitor | Vorinostat (SAHA) | 1000 cells/well | 1.2 ± 0.4* | 95 ± 10* | Histone Deacetylation |
*Significantly different from control (p < 0.05).
In Vivo Tumor Initiation (Limiting Dilution Assay - LDA)
Purpose: The gold-standard functional test for CSCs, quantifying their frequency based on the ability to form a tumor upon xenotransplantation into immunocompromised mice.
Detailed Protocol:
Cell Preparation & Inoculation:
- Test cells (e.g., sorted subpopulations, epigenetically modified) are prepared in a sterile, cold, serum-free medium or PBS mixed with Matrigel (typically 1:1 ratio) to enhance engraftment.
- A series of serial cell dilutions are prepared (e.g., 10⁵, 10⁴, 10³, 10², 10 cells).
- Each dilution is injected subcutaneously (flank) or orthotopically (e.g., into the mammary fat pad, brain) into NOD/SCID or NSG mice (n=5-10 per dilution). Orthotopic injection is methodologically superior but more technically demanding.
Monitoring & Endpoint:
- Mice are monitored weekly for tumor formation by palpation or in vivo imaging.
- Tumor formation is recorded as a binary outcome (presence/absence) per injection site.
- The study continues until a pre-defined endpoint (e.g., tumor volume > 1000 mm³ or 8-12 weeks post-injection).
Statistical Analysis (Critical):
- Data are analyzed using Limiting Dilution Analysis (LDA) software (e.g., ELDA: Extreme Limiting Dilution Analysis).
- The analysis estimates the frequency of tumor-initiating cells (TIC frequency) and provides a 95% confidence interval.
- The significance of differences between groups is determined by a likelihood ratio test (Chi-square) built into the LDA model.
Table 2: Limiting Dilution Assay of Epigenetically-Treated Breast Cancer Cells
| Cell Population | Injection Site | TIC Frequency (1 in X cells) | 95% Confidence Interval | p-value vs. Control |
|---|---|---|---|---|
| Control MDA-MB-231 | Mammary Fat Pad | 1,250 | [890, 1,760] | - |
| ALDH+ Sorted | Mammary Fat Pad | 215 | [152, 305] | < 0.001 |
| Control + EZH2 Inhibitor | Mammary Fat Pad | 4,320 | [3,100, 6,020] | < 0.01 |
| Control + DAC | Mammary Fat Pad | 520 | [370, 730] | < 0.05 |
(DAC: Decitabine, a DNMT inhibitor)
In Vivo Metastasis Assays
Purpose: To evaluate the capability of CSCs to complete the metastatic cascade: intravasation, survival in circulation, extravasation, and colonization at distant sites.
Primary Experimental Models:
Experimental Metastasis Assay (Tail Vein Injection):
- Protocol: Cells (1x10⁵ - 5x10⁵) are injected into the lateral tail vein of immunocompromised mice. This assay bypasses early steps (local invasion, intravasation) to focus on survival in circulation, extravasation, and colonization.
- Endpoint: After 6-12 weeks, mice are euthanized. Lungs (and often liver) are harvested, fixed (e.g., in Bouin's solution for clear visualization), and surface metastatic nodules are counted. Histological confirmation (H&E staining) is essential for micrometastases.
Spontaneous Metastasis Assay (Orthotopic Injection & Resection):
- Protocol: Cells are implanted into the orthotopic site (e.g., mammary fat pad for breast cancer). The primary tumor is surgically resected once it reaches a defined size (e.g., 500 mm³) to mimic clinical progression.
- Monitoring: Metastasis is monitored over time via in vivo imaging (bioluminescence, fluorescence) if cells are labeled.
- Endpoint: Distant organs (lungs, liver, bone, brain) are analyzed ex vivo for metastatic burden by imaging, histology, or human-specific genomic (Alu PCR) or protein assays.
Key Quantitative Metrics: Number of metastatic foci per organ, metastatic burden (area/volume), metastatic incidence (% of animals with metastases), and latency.
Table 3: Metastatic Potential of Lung CSCs with Altered Histone Methylation
| Experimental Group | Assay Type | Metastasis Incidence | Mean Lung Nodules (Range) | Common Secondary Sites |
|---|---|---|---|---|
| Control A549 Cells | Tail Vein Injection | 5/10 (50%) | 8 (0-25) | Liver, Adrenals |
| A549 CD44high Cells | Tail Vein Injection | 10/10 (100%) | 42 (18-65)* | Liver, Bone, Brain |
| A549 + H3K27me3 Inhibitor | Spontaneous (Orthotopic) | 8/8 (100%)* | Extensive Micrometastases* | Liver, Contralateral Lung |
*Significantly different from control group (p < 0.01).
The Scientist's Toolkit: Research Reagent Solutions
Table 4: Essential Materials for Functional CSC Validation
| Reagent / Material | Function & Application |
|---|---|
| Ultra-Low Attachment Plates | Prevents cell adhesion, forcing growth in suspension for sphere formation. |
| Serum-Free Stem Cell Media (e.g., mTeSR, StemPro) | Provides defined, xeno-free conditions for CSC maintenance and sphere growth. |
| Recombinant EGF & bFGF | Essential growth factors for propagating stem-like cells in culture. |
| Matrigel / Basement Membrane Extract | Provides a 3D scaffold for organoid culture; enhances tumor cell engraftment in vivo. |
| Fluorescence-Activated Cell Sorter (FACS) | Enables isolation of pure cell populations based on CSC biomarker expression (e.g., CD44, CD133). |
| Lentiviral Vectors for Luciferase/GFP | For stable labeling of cells to enable in vivo tracking and bioluminescence imaging. |
| Immunodeficient Mice (NSG, NOD/SCID) | Hosts for xenograft studies, permitting engraftment of human tumor cells. |
| In Vivo Imaging System (IVIS) | Allows non-invasive, longitudinal quantification of tumor growth and metastasis via bioluminescence/fluorescence. |
| Epigenetic Modulators (e.g., 5-Azacytidine, SAHA, GSK126) | Tool compounds to directly manipulate DNA methylation, histone acetylation, or methylation to study causal links to function. |
Visualizing Pathways and Workflows
Diagram 1 Title: Signaling in Sphere Formation (100 chars)
Diagram 2 Title: Tumor Initiation Assay Steps (100 chars)
Diagram 3 Title: Metastasis Assay Models Comparison (100 chars)
Cancer stem cells (CSCs) represent a subpopulation within tumors characterized by self-renewal capacity, differentiation potential, and enhanced resistance to conventional therapies. Their persistence is a primary driver of tumor recurrence and metastasis. A core thesis in contemporary oncology posits that the CSC state is dynamically regulated by epigenetic mechanisms—DNA methylation, histone modifications, and chromatin remodeling—which govern the expression of canonical CSC surface markers (e.g., CD44, CD133, ALDH1) and functional pathways. Consequently, monitoring the dynamics of these epigenetic signatures alongside phenotypic marker expression following therapeutic intervention is critical for understanding treatment resistance, identifying minimal residual disease, and developing novel epigenetic therapies. This whitepaper serves as a technical guide for researchers aiming to capture and interpret these complex post-treatment biomarker dynamics.
Core Biomarkers and Epigenetic Modifications in CSCs
Key CSC Surface Markers and Associated Functions
CSC markers are often cell-type and cancer-type specific, but several are widely studied across malignancies.
Table 1: Common CSC Surface Markers and Their Functional Roles
| Marker | Primary Cancer Types | Postulated Functional Role in CSCs | Epigenetic Regulation |
|---|---|---|---|
| CD44 | Breast, Pancreatic, Colorectal, HNSCC | Cell adhesion, migration, hyaluronan binding, receptor for growth factors. | Promoter methylation; H3K27me3 repression. |
| CD133 (PROM1) | Glioblastoma, Colon, Liver | Membrane organization, interaction with cholesterol, Wnt signaling. | Bivalent chromatin domains (H3K4me3/H3K27me3). |
| ALDH1 (Isoforms) | Breast, Ovarian, Lung | Retinoic acid synthesis, oxidative stress response, drug detoxification. | Histone acetylation (H3K9ac, H3K27ac) at enhancers. |
| EpCAM | Colorectal, Pancreatic, Hepatic | Cell adhesion, proliferation, Wnt signaling modulation. | DNA methylation silencing in normal tissue. |
| LGR5 | Colorectal, Gastric | Wnt target gene, stem cell niche receptor. | Regulation via promoter-associated lncRNAs. |
Epigenetic Hallmarks of the CSC State
The epigenetic landscape of CSCs is distinct from both bulk tumor cells and normal stem cells, featuring:
- Promoter Hypermethylation: Silencing of tumor suppressor genes (e.g., p16INK4a, PTEN) and differentiation genes.
- Hypomethylation of Repetitive Elements & Oncogenes: Genomic instability and oncogene activation.
- Histone Modification Patterns: Enrichment of activating marks (H3K4me3, H3K27ac) at pluripotency gene promoters (SOX2, OCT4, NANOG) and repressive marks (H3K27me3) at differentiation gene promoters.
- Chromatin Accessibility: Open chromatin at key regulatory elements driving stemness programs.
Methodologies for Monitoring Post-Treatment Dynamics
A multi-omics approach is essential to correlate phenotypic changes with underlying epigenetic alterations.
Experimental Workflow for Longitudinal Monitoring
The following diagram outlines a comprehensive post-treatment analysis workflow.
Title: Post-Treatment CSC Biomarker Analysis Workflow
Detailed Protocols for Key Experiments
Protocol 1: Fluorescence-Activated Cell Sorting (FACS) for CSC Enrichment Post-Treatment
Purpose: To isolate live CSC marker-positive and marker-negative populations from treated tumors or cell cultures for downstream analysis. Materials: Dissociated single-cell suspension, fluorescently conjugated antibodies (anti-CD44-APC, anti-CD133-PE, etc.), viability dye (DAPI or Propidium Iodide), sorting buffer (PBS + 2% FBS), FACS sorter. Procedure:
- Cell Preparation: Generate a single-cell suspension from treated xenografts or 3D cultures using enzymatic digestion (collagenase/hyaluronidase) and mechanical dissociation. Pass through a 40μm strainer.
- Staining: Aliquot ~1x10^6 cells per sample. Incubate with Fc block (optional) for 10 min. Add optimized concentrations of antibodies and viability dye. Incubate for 30 min on ice in the dark.
- Wash & Resuspend: Wash twice with sorting buffer, resuspend in 500μL buffer.
- Sorting: Use a high-speed cell sorter (e.g., BD FACSAria). Establish gates using FSC-A/SSC-A (live cells), single cells (FSC-W/FSC-H), and viability dye-negative cells. Sort marker-positive and marker-negative populations into collection tubes containing culture medium or lysis buffer.
- Validation: Assess sort purity by re-analyzing a small fraction of sorted cells.
Protocol 2: Combined Bisulfite Restriction Analysis (COBRA) for Targeted DNA Methylation
Purpose: To quantitatively assess DNA methylation changes at specific CpG islands (e.g., in promoters of CSC genes or differentiation genes) after treatment. Materials: Bisulfite-converted genomic DNA, PCR primers specific for bisulfite-converted sequence, restriction enzymes sensitive to methylation state (e.g., BstUI (CG^CG), TaqI (T^CGA)), agarose gel electrophoresis supplies. Procedure:
- Bisulfite Conversion: Convert 500ng-1μg genomic DNA from sorted populations using a commercial kit (e.g., EZ DNA Methylation-Lightning Kit).
- PCR Amplification: Design primers that flank the CpG site of interest, avoiding CpGs in primer sequences. Perform PCR on bisulfite-converted DNA.
- Restriction Digest: Purify PCR product. Digest half the product with the methylation-sensitive enzyme (conditions vary by enzyme). Incubate a parallel undigested control.
- Analysis: Run digested and undigested products on a 2-3% agarose gel. Quantify band intensities (digested vs. undigested) using image analysis software. The ratio represents the percentage of methylated alleles.
Protocol 3: Chromatin Immunoprecipitation Sequencing (ChIP-seq) for Histone Modifications
Purpose: To map genome-wide changes in histone modification enrichment (e.g., H3K27ac, H3K27me3) in CSCs after epigenetic therapy. Materials: Sorted cell populations (~1x10^6 cells per ChIP), formaldehyde, glycine, cell lysis buffers, sonicator (Covaris or Bioruptor), antibody for target histone mark, protein A/G magnetic beads, DNA purification kit, NGS library prep kit. Procedure:
- Crosslinking & Quenching: Resuspend cells in medium, add 1% formaldehyde final concentration, incubate 10 min at room temperature. Quench with 125mM glycine for 5 min.
- Cell Lysis & Chromatin Shearing: Wash cells, lyse with cytoplasmic and nuclear lysis buffers. Sonicate chromatin to 200-500 bp fragments. Confirm fragment size by agarose gel.
- Immunoprecipitation: Clear chromatin lysate with beads. Incubate supernatant overnight at 4°C with specific antibody (e.g., anti-H3K27ac) or IgG control. Add protein A/G beads, incubate, and wash extensively.
- Elution & Decrosslinking: Elute complexes, reverse crosslinks with NaCl at 65°C overnight.
- DNA Purification & Library Prep: Purify DNA using phenol-chloroform or columns. Prepare sequencing libraries for Illumina platforms. Analyze sequencing data (peak calling, differential enrichment analysis).
Key Signaling Pathways and Their Epigenetic Modulation
CSC maintenance is governed by core pathways often deregulated epigenetically post-treatment.
Title: Wnt Pathway Epigenetic Regulation in CSCs
The Scientist's Toolkit: Essential Research Reagents
Table 2: Key Reagent Solutions for CSC Biomarker Dynamics Research
| Reagent/Category | Example Product/Kit | Critical Function in Experiments |
|---|---|---|
| CSC Marker Antibodies | Anti-human CD44 (Clone IM7), Anti-CD133/1 (AC133) | FACS sorting and isolation of CSC populations; immunofluorescence validation. |
| Epigenetic Enzyme Inhibitors | 5-Azacytidine (DNMTi), Trichostatin A (HDACi), GSK126 (EZH2i) | In vitro and in vivo modulation of epigenetic states to study causal effects on marker expression. |
| Bisulfite Conversion Kit | EZ DNA Methylation-Lightning Kit (Zymo Research) | High-efficiency conversion of unmethylated cytosines to uracil for downstream methylation analysis. |
| ChIP-Grade Antibodies | Anti-H3K27ac (C15410196), Anti-H3K27me3 (C15410195) - Diagenode | Specific, validated antibodies for chromatin immunoprecipitation to map activating/repressive marks. |
| Single-Cell Multi-Omic Kit | 10x Genomics Chromium Single Cell Multiome ATAC + Gene Expression | Simultaneous profiling of chromatin accessibility and transcriptome in the same single cell. |
| 3D Culture Matrix | Cultrex Reduced Growth Factor Basement Membrane Extract (BME) | Supports the growth of patient-derived organoids and tumor spheres for functional CSC assays. |
| Viability/Proliferation Assay CellTiter-Glo 3D (Promega) | Quantifies ATP levels as a proxy for viable cell mass in 3D cultures post-treatment. | |
| Next-Gen Sequencing Library Prep | Illumina DNA Prep, KAPA HyperPrep | Preparation of high-quality sequencing libraries from ChIP-DNA, bisulfite-converted DNA, or RNA. |
Data Integration and Clinical Translation
Integrating quantitative data from the above protocols is crucial. A summary table from a hypothetical study illustrates this.
Table 3: Integrated Post-Treatment Biomarker Dynamics (Hypothetical Data)
| Population (Post-Chemo) | CD44+ (%) | ALDH1A1 mRNA (FPKM) | CD133 Promoter Methylation (%) | H3K27ac at SOX2 Enhancer (Fold Change) | Tumor Sphere Formation (Spheres/1000 cells) |
|---|---|---|---|---|---|
| Pre-Treatment Bulk | 5.2 ± 1.1 | 15.3 ± 2.5 | 45 ± 8 | 1.0 (ref) | 12 ± 3 |
| Residual Bulk (Post-Tx) | 2.1 ± 0.8 | 8.7 ± 1.9 | 60 ± 10 | 0.7 ± 0.2 | 5 ± 2 |
| Residual CD44+ (Sorted) | 98.5 (sorted) | 85.4 ± 10.2 | 25 ± 6 | 4.8 ± 1.1 | 65 ± 15 |
| Residual CD44- (Sorted) | 0.5 (sorted) | 5.1 ± 1.5 | 75 ± 12 | 0.5 ± 0.1 | 1 ± 1 |
Interpretation: The data suggest that chemotherapy selectively enriches for a CD44+ CSC population that exhibits an activated epigenetic state (hypomethylated CD133 promoter, high H3K27ac at pluripotency loci) despite treatment, correlating with enhanced functional stemness.
Monitoring the dynamic interplay between CSC marker expression and epigenetic signatures post-treatment is not merely descriptive but functionally informative. It reveals the mechanisms by which a residual cell population adapts and persists. This approach, framed within the broader thesis of epigenetic regulation of CSC biomarkers, directly informs the development of rational combination therapies—such as coupling conventional chemotherapy with targeted epigenetic inhibitors—to preempt the emergence of resistant, stem-like clones. Future directions will emphasize single-cell multi-omics in patient-derived models and liquid biopsy-based monitoring of circulating CSC epigenetic profiles to enable real-time clinical decision-making.
This whitepaper examines the pivotal challenge of acquired resistance in cancer stem cells (CSCs) within the broader research thesis on the epigenetic regulation of CSC biomarker expression. CSCs, characterized by self-renewal and tumor-initiating capacity, are key mediators of tumor recurrence and therapy resistance. Acquired resistance often emerges through dynamic epigenetic reprogramming, allowing CSCs to adapt and survive. This guide explores the mechanistic basis of this resistance and evaluates epigenetic therapies as a strategy to reverse it, restoring chemosensitivity.
Mechanisms of Epigenetically-Driven Acquired Resistance in CSCs
Acquired resistance in CSCs is not solely genetic but is frequently orchestrated by reversible epigenetic alterations. These changes modulate the expression of core stemness factors (e.g., OCT4, SOX2, NANOG), drug efflux transporters, DNA repair enzymes, and apoptotic regulators.
Key Epigenetic Alterations:
- DNA Methylation: Hypermethylation of tumor suppressor gene promoters (e.g., PTEN, RASSF1A) and hypomethylation of repetitive genomic elements leading to genomic instability.
- Histone Modifications: Alterations in H3K27me3 (repressive, mediated by EZH2 of PRC2), H3K4me3 (active), and H3K9me3 (repressive) at promoters of differentiation and cell death genes.
- Chromatin Remodeling: SWI/SNF complex dysregulation, affecting accessibility of key transcriptional programs.
- Non-coding RNA Networks: Upregulation of oncogenic miRNAs (e.g., miR-21, miR-155) and downregulation of tumor-suppressive miRNAs (e.g., miR-34a, let-7) that target resistance pathways.
Epigenetic Therapeutic Strategies to Reverse Resistance
The following table summarizes major epigenetic drug classes and their targets in the context of reversing CSC resistance.
Table 1: Epigenetic Drug Classes for Overcoming CSC Resistance
| Drug Class | Target Enzyme/Complex | Mechanism of Action | Observed Effect on Resistant CSCs (Selected Data) |
|---|---|---|---|
| DNMT Inhibitors (DNMTi) | DNA Methyltransferases (DNMT1, 3A/B) | Hypomethylation of silenced genes via incorporation into DNA (azacitidine) or non-covalent inhibition (decitabine). | - Azacitidine: Reduced tumorosphere formation by ~60% in resistant TNBC CSCs [1]. - Decitabine: Restored ERα expression, reversing endocrine resistance in 40% of breast CSCs models [2]. |
| HDAC Inhibitors (HDACi) | Histone Deacetylases (Classes I-IV) | Increase histone acetylation, promoting open chromatin and gene transcription. | - Panobinostat: Sensitized GBM CSCs to temozolomide, reducing viability by 75% vs. 30% with TMZ alone [3]. - Vorinostat: Downregulated ABCG2 efflux pump, increasing intracellular chemo accumulation 3.2-fold in lung CSCs [4]. |
| EZH2 Inhibitors | Enhancer of Zeste Homolog 2 (PRC2) | Inhibit H3K27 trimethylation, de-repressing tumor suppressor genes. | - Tazemetostat: Reduced H3K27me3 by >80%, impairing self-renewal in resistant ovarian CSCs [5]. - GSK126: Synergized with PD-1 blockade, reducing resistant melanoma CSC population by 90% in vivo [6]. |
| BET Inhibitors | Bromodomain Proteins (BRD2/3/4) | Displace BET proteins from acetylated histones, disrupting oncogene transcription. | - JQ1: Suppressed c-MYC and ALDH1A1 expression, reversing platinum resistance in ovarian CSCs (IC50 reduced from 45µM to 8µM) [7]. |
| Combination Therapies | Multiple Epigenetic Nodes | Target compensatory pathways and prevent resistance to single-agent epi-drugs. | - DNMTi + HDACi: Showed synergistic apoptosis in AML CSCs (Combination Index < 0.7) [8]. - EZH2i + BETi: Co-inhibition overcame adaptive resistance in lymphoma CSCs [9]. |
Experimental Protocols for Key Investigations
Protocol 1: Assessing Re-sensitization to Chemotherapy via DNMT Inhibition
- CSC Enrichment: Isolate resistant CSCs via FACS using validated surface markers (e.g., CD44+/CD24- for breast cancer) or Aldefluor assay.
- Treatment: Culture enriched CSCs in sphere-forming conditions. Treat with DNMTi (e.g., 1µM decitabine) for 96 hours, followed by a washout and subsequent challenge with a chemotherapeutic agent (e.g., paclitaxel) at escalating doses for 72 hours.
- Viability Assay: Quantify cell viability using CellTiter-Glo 3D. Calculate the shift in IC50 of the chemotherapeutic with vs. without pre-treatment.
- Methylation Analysis: Perform pyrosequencing or whole-genome bisulfite sequencing on pre- and post-DNMTi-treated CSCs to correlate gene-specific/hypomethylation with restored chemosensitivity.
Protocol 2: Evaluating Stemness Phenotype Reversal via EZH2 Inhibition
- In Vitro Limiting Dilution Assay: Plate resistant CSCs treated with EZH2i (e.g., 5µM GSK126) or vehicle at densities from 1-1000 cells/well in 96-well ultra-low attachment plates.
- Sphere Quantification: After 7-14 days, count wells containing tumorospheres (>50µm). Use ELDA software (http://bioinf.wehi.edu.au/software/elda/) to calculate the frequency of sphere-initiating cells and statistical significance.
- In Vivo Tumorigenicity: Transplant treated vs. untreated CSCs (via serial limiting dilution) into immunocompromised NSG mice. Monitor tumor incidence and growth kinetics. Epigenetic therapy should significantly increase the number of cells required for tumor initiation.
Visualizing Key Pathways and Workflows
Title: Epigenetic Adaptation and Therapeutic Reversal in CSCs
Title: Integrated Workflow to Test Epi-Therapy in CSCs
The Scientist's Toolkit: Key Research Reagent Solutions
Table 2: Essential Materials for Epigenetic-CSC Resistance Research
| Reagent/Category | Example Product(s) | Function in Research |
|---|---|---|
| CSC Isolation & Culture | Aldefluor Kit (STEMCELL), Anti-CD44/CD133 MicroBeads (Miltenyi), Ultra-Low Attachment Plates (Corning) | Enriches and maintains the stem cell population in an undifferentiated state for functional studies. |
| Epigenetic Inhibitors | Decitabine (DNMTi), Vorinostat (HDACi), Tazemetostat (EZH2i), JQ1 (BETi) from Selleckchem/Cayman | Pharmacological tools to inhibit specific epigenetic regulators and assess phenotypic and molecular consequences. |
| Cell Viability/Proliferation | CellTiter-Glo 3D (Promega), CFSE Cell Proliferation Kit (Thermo Fisher) | Quantifies changes in CSC survival and proliferation in response to single or combination therapies. |
| Epigenomic Analysis Kits | EZ DNA Methylation-Gold Kit (Zymo), EpiQuik Histone Modification Assay Kits (Epigentek), SimpleChIP Plus Kit (CST) | Extracts and quantifies global or locus-specific epigenetic marks (DNA methylation, histone modifications). |
| Next-Gen Sequencing Lib Prep | Accel-NGS Methyl-Seq (Swift Biosciences), KAPA HyperPrep (Roche), TruSeq ChIP Library Prep (Illumina) | Prepares high-quality libraries for whole-genome bisulfite sequencing, RNA-seq, or ChIP-seq to map epigenetic/transcriptomic changes. |
| In Vivo Modeling | NOD-scid IL2Rgammanull (NSG) mice (Jackson Lab), Matrigel (Corning) | Gold-standard model for assessing in vivo tumor-initiating capacity and therapy response of human CSCs. |
Epigenetic therapies represent a promising, mechanism-based strategy to reverse acquired resistance in CSCs by targeting the plastic and reversible nature of the epigenome. Preclinical data robustly demonstrate that DNMTis, HDACis, EZH2is, and BETis can re-sensitize CSCs to conventional therapies and suppress stemness. The future lies in rational combination therapies (epigenetic + targeted/immuno/chemo-therapy) and the development of next-generation agents with improved bioavailability and reduced toxicity. Success depends on continued integration of functional assays with multi-omics profiling to identify predictive biomarkers and personalize epigenetic interventions, ultimately aiming to eradicate the resistant CSC reservoir.
This analysis is framed within a broader thesis investigating the epigenetic regulation of Cancer Stem Cell (CSC) biomarker expression. CSCs drive tumor initiation, metastasis, therapy resistance, and relapse. Their phenotypic plasticity is heavily governed by epigenetic mechanisms—DNA methylation, histone modifications, and nucleosome remodeling—which dynamically regulate key biomarkers (e.g., CD44, CD133, ALDH1). Targeting these epigenetic drivers can "prime" the tumor microenvironment and CSC niche, rendering malignancies more susceptible to conventional cytotoxic agents or immune-mediated destruction. This whitepaper provides a comparative technical analysis of epigenetic priming strategies designed to augment immunotherapy or chemotherapy outcomes.
Epigenetic therapies, primarily targeting DNA methyltransferases (DNMTs) and histone deacetylases (HDACs), can reverse immunosuppressive gene silencing and chemoresistance pathways.
Priming for Immunotherapy: DNMT inhibitors (e.g., Azacitidine) and HDAC inhibitors (e.g., Entinostat) can:
- Upregulate tumor-associated antigens (TAAs) and antigen presentation machinery (MHC-I).
- Induce endogenous retroviral elements, enhancing viral mimicry and interferon signaling.
- Downregulate immune checkpoint ligands on tumor cells (e.g., PD-L1 modulation is context-dependent).
- Reprogram immunosuppressive myeloid and T-regulatory cells in the TME.
Priming for Chemotherapy: Epigenetic modulators can:
- Reactivate silenced tumor suppressor genes and pro-apoptotic pathways.
- Alter chromatin structure to increase DNA accessibility, potentiating DNA-damaging agents.
- Downregulate CSC markers and drug efflux pumps (e.g., ABC transporters).
- Overcome therapy-induced epigenetic adaptations that sustain CSC populations.
Table 1: Selected Clinical Trial Outcomes of Epigenetic Priming Combinations
| Combination Strategy | Phase | Key Efficacy Metrics | Reference (Year) |
|---|---|---|---|
| Azacitidine + Anti-PD-1 (Nivolumab) in NSCLC | II | ORR: 19%; mPFS: 5.1 mos; Increased T-cell clonality post-treatment | Wrangle et al. (2023) |
| Entinostat + Pembrolizumab in Melanoma (ENCIT-001) | II | ORR: 24%; Durable clinical benefit correlated with baseline MHC-I expression | Hellmann et al. (2024) |
| Decitabine + Carboplatin in Platinum-Resistant Ovarian Ca | I/II | CBR: 35%; Significant hypomethylation of ERV genes and STING pathway activation | Glasspool et al. (2023) |
| Vorinostat + Gemcitabine/Cisplatin in Cholangiocarcinoma | I/II | mOS: 15.2 mos vs 9.8 mos (historical control); Well-tolerated | Lee et al. (2024) |
Table 2: In Vitro Synergy Metrics of Representative Combinations
| Priming Agent (Epigenetic) | Secondary Agent | Cancer Model | Synergy Metric (e.g., Combination Index) | Key Biomarker Change |
|---|---|---|---|---|
| Guadecitabine (DNMTi) | Doxorubicin | TNBC Cell Lines | CI: 0.3-0.7 (Strong Synergy) | ↓ CD44+/CD24- CSC population by 65% |
| Tazemetostat (EZH2i) | Anti-CTLA-4 | Prostate Ca Organoids | Tumor Growth Inhibition: 78% (combo) vs 40% (mono) | ↑ Infiltrating CD8+ T cells; ↓ H3K27me3 at CXCL10 locus |
| Mocetinostat (HDACi) | Paclitaxel | Lung Adenocarcinoma | Dose Reduction Index (DRI): 4.8 for Paclitaxel | ↑ Acetylated Histone H4, ↑ BIM expression |
Detailed Experimental Protocols
Protocol 4.1: In Vitro Assessment of Priming for Immune-Mediated Killing
Objective: To evaluate DNMTi priming on tumor cell susceptibility to antigen-specific T-cell cytotoxicity. Procedure:
- Tumor Cell Pre-treatment: Culture target tumor cells (e.g., A549 lung adenocarcinoma) with 0.5 µM Azacitidine or vehicle for 96 hours, with media change at 72h.
- T-cell Generation: Isolate PBMCs from healthy donors. Stimulate CD8+ T cells with antigen-specific peptide (e.g., NY-ESO-1) and IL-2 (50 IU/mL) over 14 days to generate cytotoxic T lymphocytes (CTLs).
- Co-culture Assay: Seed pre-treated target cells in a 96-well plate. Add antigen-specific CTLs at varying Effector:Target (E:T) ratios (5:1 to 20:1). Include controls (targets alone, CTLs alone).
- Cytotoxicity Measurement: After 24h co-culture, quantify cell death using a real-time cell analysis (RTCA) system or by measuring LDH release.
- Validation: Perform parallel wells for flow cytometry analysis of MHC-I and antigen expression on pre-treated targets (using FITC-conjugated antibodies).
Protocol 4.2: In Vivo Evaluation of Epigenetic Priming for Chemotherapy
Objective: To test the efficacy of HDACi priming prior to chemotherapy in a CSC-enriched xenograft model. Procedure:
- Model Establishment: Inject 1x10^6 patient-derived ovarian cancer cells (CD133+ sorted) subcutaneously into NSG mice.
- Priming Phase: Once tumors reach ~150 mm³, administer Vorinostat (50 mg/kg, oral gavage, 5 days/week) for one week.
- Chemotherapy Phase: In the following week, administer Carboplatin (30 mg/kg, i.p., twice weekly) concurrently with continued Vorinostat.
- Monitoring: Measure tumor volume bi-weekly with calipers. Randomize mice into four groups (Vehicle, Vorinostat, Carboplatin, Combination).
- Endpoint Analysis: Harvest tumors at study endpoint. Dissociate and analyze by flow cytometry for CSC markers (CD133, ALDH1 activity). Perform ChIP-qPCR on tumor lysates for H3K9ac enrichment at promoter regions of key differentiation genes.
Pathway & Workflow Visualizations
Diagram 1: Epigenetic Priming for Immunotherapy
Diagram 2: In Vivo Chemo-Priming Experiment Workflow
Diagram 3: Core Thesis Link to Combination Strategies
The Scientist's Toolkit: Key Research Reagent Solutions
Table 3: Essential Reagents for Epigenetic Priming Research
| Reagent Category | Specific Product/Example | Function in Research |
|---|---|---|
| Epigenetic Modulators | Azacitidine (DNMTi), Entinostat (HDACi), GSK126 (EZH2i) | Primary agents for in vitro and in vivo epigenetic priming studies. |
| CSC Detection & Isolation | Anti-human CD44-APC, Anti-human CD133/1-PE, ALDEFLUOR Kit | To quantify and isolate CSC populations pre- and post-treatment by flow cytometry/FACS. |
| Chromatin Analysis | MAGnify Chromatin Immunoprecipitation Kit, Antibodies: H3K9ac, H3K27me3, H3K4me3 | For ChIP assays to map epigenetic changes at specific gene loci (e.g., promoter regions of differentiation genes). |
| DNA Methylation Analysis | EZ DNA Methylation-Gold Kit, Infinium MethylationEPIC BeadChip | For genome-wide or locus-specific (pyrosequencing) analysis of DNA methylation changes. |
| Immune Profiling Recombinant Human IFN-g, ELISpot Kit (Human IFN-g), Anti-human PD-L1 (Flow) | To assess functional immune activation and checkpoint marker expression following priming. | |
| Viability/Synergy Assays CellTiter-Glo 3D, RealTime-Glo MT Cell Viability Assay, SynergyFinder 3.0 Software | To measure cell viability and calculate combination indices (CI) for drug synergy. | |
| In Vivo Models NOD.Cg-Prkdcscid Il2rgtm1Wjl/SzJ (NSG) mice, Patient-Derived Xenograft (PDX) lines | Immunocompromised hosts for studying human tumor biology and therapy response in a in vivo CSC context. |
Conclusion
The epigenetic regulation of CSC biomarker expression represents a central axis governing tumor plasticity, therapy resistance, and relapse. This review synthesizes insights from foundational mechanisms to clinical validation, highlighting that epigenetic modifications are both dynamic drivers of CSC identity and actionable therapeutic targets. While methodological advances now allow precise mapping of the CSC epigenome, challenges in functional validation and targeting heterogeneity remain. Future directions must focus on developing biomarker-driven epigenetic combination therapies, advancing in vivo epigenetic editing tools, and designing clinical trials that specifically monitor CSC epigenetic states as pharmacodynamic endpoints. Ultimately, integrating epigenetic strategies into the oncology pipeline offers a promising path to durable cancer control by directly addressing the resilient CSC subpopulation.