Interstitial Flow Dynamics: Orchestrating Immune Cell Migration in the Tumor Microenvironment
This review synthesizes current research on how interstitial fluid flow within the tumor microenvironment critically governs immune cell migration and function.
Interstitial Flow Dynamics: Orchestrating Immune Cell Migration in the Tumor Microenvironment
Abstract
This review synthesizes current research on how interstitial fluid flow within the tumor microenvironment critically governs immune cell migration and function. Targeting researchers and drug developers, it explores foundational biophysical principles, advanced in vitro and in silico methodologies for modeling flow effects, common experimental challenges and optimization strategies, and comparative analyses of different flow regimes. The article aims to provide a comprehensive resource for understanding and leveraging this key biomechanical cue to enhance immunotherapeutic strategies.
The Biomechanical Blueprint: Understanding How Interstitial Flow Shapes Immune Trafficking
Within the complex tumor microenvironment (TME), interstitial flow (IF) is the pervasive, slow movement of fluid through the extracellular matrix (ECM). This in-depth guide explores IF's origins in tumor-specific pathophysiology, its magnitude as a critical biophysical force, and its directionality, which shapes cell fate and immune responses. Framed within a broader thesis on IF-driven immune cell migration, this document provides a technical foundation for researchers and drug development professionals aiming to leverage IF dynamics for novel therapeutic strategies.
Interstitial flow is the convective transport of fluid and solutes within tissue interstitium, driven by hydraulic pressure gradients. In solid tumors, dysregulated vasculature and compromised lymphatic drainage create pronounced, pathophysiological IF. This flow is not a passive consequence but an active signaling mechanism, modulating cell migration (notably of immune cells), fibrosis, angiogenesis, and metastasis. Understanding its precise parameters is fundamental to decoding TME communication networks.
Origins of Interstitial Flow in Solid Tumors
The genesis of elevated IF in tumors stems from a combination of abnormal fluid handling systems.
- Elevated Microvascular Pressure: Tumor vessels are leaky due to VEGF-induced hyperpermeability and lack proper pericyte coverage, leading to excessive fluid extravasation (Starling's Law).
- Lymphatic Dysfunction: Tumors often have non-functional or compressed lymphatic vessels, impairing fluid drainage and causing accumulation.
- Solid Stress & ECM Remodeling: Tumor growth exerts solid stress, compressing vessels and interstitium, while matrix stiffening and alignment (collagen, fibronectin) create channels that guide flow direction.
Table 1: Primary Drivers of Elevated Interstitial Flow in Tumors
| Driver | Mechanism | Consequence for IF |
|---|---|---|
| Leaky Vasculature | VEGF overexpression, disrupted endothelial junctions. | Increased fluid extravasation; raises source pressure. |
| Lymphatic Dysfunction | Lack of functional intratumoral lymphatics. | Reduced fluid drainage; eliminates sink. |
| Matrix Remodeling | LOX/LOXL-mediated crosslinking, MMP activity. | Alters hydraulic conductivity; creates anisotropic flow paths. |
| Solid Stress | Proliferative and swelling pressures from cells/ECM. | Compresses vessels and interstitium, modifying pressure gradients. |
Magnitude and Quantification of Interstitial Flow
The magnitude of IF is characterized by fluid velocity (µm/s) and interstitial fluid pressure (IFP, mmHg). In most normal tissues, IFP is near 0 mmHg. In solid tumors, IFP can rise to match microvascular pressure (~10-40 mmHg), collapsing the convective gradient and creating a "uniformly high" pressure core. However, steep gradients exist at the tumor periphery, generating significant flow.
Table 2: Measured Parameters of Interstitial Flow in Models & Patients
| Parameter | Normal Tissue | Solid Tumor (Measured Range) | Primary Measurement Technique |
|---|---|---|---|
| Interstitial Fluid Pressure (IFP) | -3 to 0 mmHg | 5 to 40 mmHg (core) | Wick-in-needle, Micropipette, Fiberoptic probe. |
| Interstitial Fluid Velocity | ~0.1 µm/s | 0.1 - 3.0 µm/s (periphery) | Fluorescent bead tracking, FRAP, in vitro microfluidic models. |
| Hydraulic Conductivity (K) | ~10⁻¹² m²/Pa·s | Variable; can increase 2-5x with remodeling. | Computed from velocity/pressure drop in engineered scaffolds. |
Direction and Guidance Cues from Flow
IF direction is dictated by the vector of the pressure gradient, typically from the high-pressure tumor core towards the lower-pressure periphery or residual lymphatic vessels. This directional flow creates critical biophysical and biochemical cues:
- Mechanical Shear Stress: Exerted on cell surfaces (≈ 0.1 - 1 dyn/cm²), sensed by integrins and primary cilia.
- Autologous Chemotaxis: Flow drag establishes soluble factor (chemokine, VEGF) gradients, guiding cell migration upstream (against flow) via a process termed autologous chemotaxis.
- Matrix-Bound Gradient Formation: Flow transports and deposits proteolytic fragments (e.g., collagen fragments) or matricellular proteins (CCN2, fibronectin), creating haptotactic cues.
Diagram 1: IF Origins, Magnitude, and Direction in a Tumor Niche
Impact on Immune Cell Migration: A Central Thesis Context
The direction and magnitude of IF are pivotal regulators of immune cell trafficking within the TME, a core focus of contemporary research.
- Dendritic Cell (DC) Migration: CCR7-dependent DC migration towards lymphatics is guided and enhanced by IF, which transports CCL19/CCL21 and presents matrix-bound signals.
- T-cell Infiltration: High IFP in the tumor core can act as a physical barrier to T-cell extravasation and penetration. Peripherally, IF-generated chemokine gradients can direct cytotoxic T lymphocytes (CTLs).
- Macrophage Polarization: IF shear stress can induce pro-tumorigenic (M2-like) polarization in macrophages via integrin-mediated signaling pathways.
Diagram 2: IF-Modulated Immune Cell Trafficking Pathways
Key Experimental Protocols for IF Study
Protocol 1: In Vitro Interstitial Flow Generation in 3D Cultures
- Objective: To study cell behavior under controlled IF in a 3D matrix.
- Materials: Microfluidic device (e.g., µ-Slide VI 0.4, Ibidi) or custom-made chamber, collagen I/Matrigel, syringe pumps, fluorescent tracers (70 kDa dextran), time-lapse microscope.
- Methodology:
- Seed cells (e.g., fibroblasts, dendritic cells) in collagen gel within the central chamber.
- Connect medium-filled reservoirs to either end via agarose gel bridges (to prevent chemotactic gradients) or directly to channels.
- Use syringe pumps to apply a hydrostatic pressure difference (e.g., 2-10 mm H₂O), generating ~0.5-3 µm/s flow through the gel.
- Image cell migration (phase-contrast) and tracer distribution (fluorescence) over 6-24h.
- Quantify migration speed and directionality relative to flow vector.
Protocol 2: In Vivo Interstitial Fluid Pressure (IFP) Measurement
- Objective: To measure intratumoral IFP in mouse models.
- Materials: Anesthetized tumor-bearing mouse, wick-in-needle system or fiberoptic pressure transducer (e.g., Samba Sensors), stereotaxic frame, data acquisition software.
- Methodology (Wick-in-Needle):
- Calibrate saline-filled needle connected to a pressure transducer.
- Insert needle into the tumor core under sterile conditions.
- Allow pressure to equilibrate (2-3 minutes).
- Record stable pressure reading (mmHg). Compare to contralateral normal tissue.
- Perform multiple measurements across different tumor regions.
The Scientist's Toolkit: Research Reagent Solutions
Table 3: Essential Reagents for Interstitial Flow Research
| Reagent / Material | Function / Application | Example Product/Catalog |
|---|---|---|
| Fibrillar Collagen I, High Concentration | Provides a physiological 3D hydrogel for in vitro flow assays. | Corning Rat Tail Collagen I, 8-11 mg/mL. |
| µ-Slide VI 0.4 or IbiTreat | Commercially available microfluidic chamber for generating linear IF in 3D gels. | Ibidi, 80606 or 80106. |
| Fluorescent Dextrans (70 kDa, 155 kDa) | Inert tracers to visualize and quantify flow velocity and distribution. | Thermo Fisher Scientific, D1818, D1841. |
| Recombinant Human/Mouse CCL19 & CCL21 | Key chemokines whose gradient formation by IF drives CCR7+ cell migration. | PeproTech, 300-29B, 250-13. |
| Integrin-Blocking Antibodies (αvβ3, β1) | To dissect the role of mechanosensing in IF responses. | BioLegend, 305602; Millipore, MABT821. |
| FAK or Src Inhibitors | Small molecules to inhibit downstream shear-stress signaling pathways. | PF-573228 (FAK Inhib.), Saracatinib (Src Inhib.). |
| Wick-in-Needle IFP Kit | For in vivo interstitial fluid pressure measurement. | Millar, Inc. (Custom systems). |
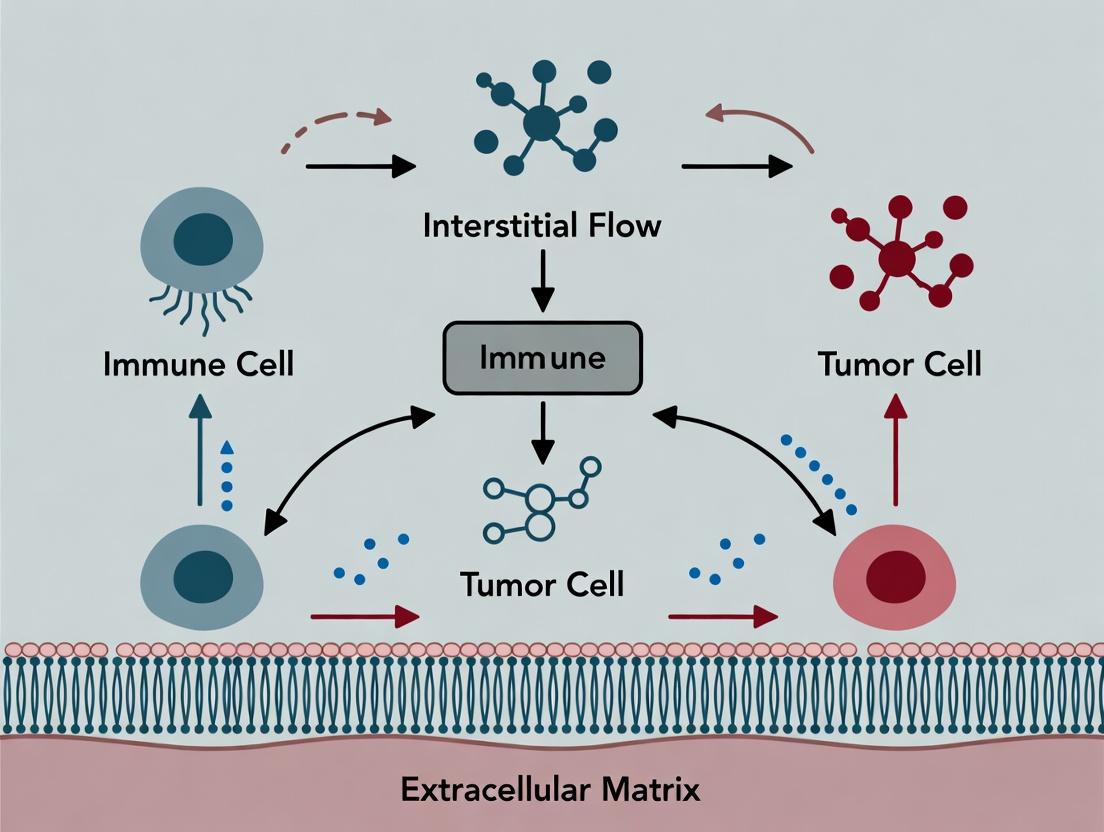
Within the tumor microenvironment (TME), interstitial flow (IF)—the convective movement of fluid through the extracellular matrix—is a critical biophysical force. This flow is often elevated in solid tumors due to vascular leakiness and lymphatic dysfunction. A growing body of research, central to the broader thesis on Interstitial flow immune cell migration tumor microenvironment research, demonstrates that immune cells are not passive passengers but active mechanosensors of these fluid forces. T cells, dendritic cells (DCs), and macrophages possess molecular machinery to transduce flow-derived mechanical signals into directed migration (mechanotaxis), altered activation states, and functional polarization, profoundly impacting anti-tumor immunity. This whitepaper provides an in-depth technical guide to the mechanisms, experimental evidence, and methodologies defining this field.
Mechanosensing Mechanisms by Cell Type
Immune cells employ a repertoire of sensors to detect interstitial flow, including integrins, G-protein coupled receptors (GPCRs), ion channels, and primary cilia.
Table 1: Core Mechanosensors and Responses to Interstitial Flow
| Immune Cell | Key Mechanosensors | Primary Flow-Induced Response | Downstream Signaling | Functional Outcome in TME |
|---|---|---|---|---|
| T Lymphocytes | α4β1 Integrin (VLA-4), Piezo1, TRPV4 | Upstream (against flow) mechanotaxis | Src-family kinase (SFK) activation, FAK phosphorylation, Ca2+ influx | Directed migration to lymphatics; Altered activation threshold |
| Dendritic Cells | CCR7, α5β1 Integrin, Primary Cilia (immature DCs) | Upstream (against flow) chemotaxis & mechanotaxis | CCL21/CCR7 axis amplification, Rho-ROCK, PI3K | Enhanced lymphatic trafficking and antigen delivery |
| Macrophages | α5β1/αvβ3 Integrins, P2Y2 receptor, TREK-1 | Flow-aligned migration, M2-like polarization | TGF-β activation, Arg-1 upregulation, YAP/TAZ nuclear translocation | Pro-tumorigenic (M2) polarization; ECM remodeling |
Detailed Experimental Protocols
Protocol 1: In Vitro Interstitial Flow Assay using a Microfluidic Chamber
- Objective: To quantify directional cell migration (mechanotaxis) under defined interstitial flow.
- Materials: Polydimethylsiloxane (PDMS) microfluidic device (e.g., µ-Slide I Luer, ibidi), collagen I hydrogel, cell culture medium, syringe pump, live-cell imaging microscope.
- Procedure:
- Prepare a 2.0-3.0 mg/ml collagen I solution. Mix with cell suspension to achieve desired density (e.g., 0.5-1x10^6 cells/ml).
- Pipette the cell-collagen mix into the central gel channel of the microfluidic device. Polymerize at 37°C for 30 min.
- Attach medium-filled reservoirs to the channel inlet and outlet via tubing.
- Mount the device on a stage-top incubator. Initiate flow using a syringe pump at a physiological shear stress (0.1-0.5 dyn/cm²) or velocity (0.1-1.0 µm/s).
- Acquire time-lapse images every 5-10 minutes for 6-24 hours using a 10x objective.
- Analysis: Track individual cell trajectories. Calculate the directionality index (DI) towards upstream vs. downstream. DI = (Net displacement in flow direction) / (Total path length). A negative DI indicates upstream migration.
Protocol 2: Assessing Flow-Induced Signaling via Calcium Imaging
- Objective: To visualize real-time intracellular Ca2+ flux upon onset of fluid shear.
- Materials: Cells loaded with Fura-2-AM or Fluo-4-AM dye, parallel-plate flow chamber, confocal or epifluorescence microscope with ratiometric capability, perfusion system.
- Procedure:
- Culture cells on a glass-bottom dish or slide. Load with 2-5 µM Ca2+ indicator dye in serum-free medium for 30-45 min at 37°C.
- Assemble the flow chamber on the microscope stage. Connect to a perfusion system with two reservoirs: one with standard medium, one with medium containing a mechanosensor agonist/inhibitor (e.g., Yoda1 for Piezo1, GsMTx-4 for Piezo1 blockade).
- Acquire a 2-minute baseline with no flow.
- Initiate laminar flow at 0.5-2.0 dyn/cm². Record fluorescence (340/380 nm excitation for Fura-2; 488 nm for Fluo-4) for 10-15 minutes.
- Analysis: Plot fluorescence intensity or ratio (F340/F380) over time for individual cells. Quantify the percentage of responsive cells, peak amplitude, and oscillation frequency.
Signaling Pathway Visualizations
Title: Core Mechanotransduction Pathway in Flow-Sensing Immune Cells
Title: Workflow for Quantifying Flow-Driven Cell Migration
The Scientist's Toolkit: Key Research Reagents & Materials
Table 2: Essential Research Reagents and Solutions
| Reagent/Material | Supplier Examples | Function in Flow Research |
|---|---|---|
| µ-Slide I Luer (0.4 µm) | ibidi GmbH | Standard microfluidic chamber for 3D gel embedding and precise application of unidirectional flow. |
| Rat Tail Collagen I, High Conc. | Corning, Advanced BioMatrix | Major component for creating physiological 3D hydrogels that mimic the interstitial matrix. |
| CellTracker Dyes (CMFDA, CMTMR) | Thermo Fisher Scientific | Fluorescent cytoplasmic labels for long-term, non-transfective tracking of mixed cell populations in co-culture. |
| Yoda1 (Piezo1 Agonist) | Tocris Bioscience, Sigma-Aldrich | Pharmacological tool to directly activate the Piezo1 channel, mimicking mechanical activation. |
| GsMTx-4 (Piezo Inhibitor) | Alomone Labs, Tocris | Selective peptide inhibitor of Piezo1 and other cationic mechanosensitive channels. |
| Recombinant CCL21 | PeproTech, R&D Systems | Key chemokine for CCR7-mediated migration; used to establish gradients in conjunction with flow. |
| Anti-Integrin β1 (Blocking Antibody, AIIB2) | Developmental Studies Hybridoma Bank | Function-blocking antibody to disrupt integrin-mediated mechanosensing and adhesion. |
| RhoA/Rac1/Cdc42 G-LISA Kits | Cytoskeleton, Inc. | Biochemically quantify activation levels of small GTPases in response to flow stimulation. |
This technical guide elucidates the function of three primary molecular mechanosensors—Integrins, Piezo1, and G Protein-Coupled Receptors (GPCRs)—in transducing interstitial flow forces within the tumor microenvironment (TME). Interstitial flow, the convective movement of fluid through extracellular matrix, is a critical biophysical cue directing immune cell migration, cancer cell invasion, and metastatic spread. Understanding the coordinated and distinct roles of these sensors is pivotal for developing therapeutic strategies to modulate immune responses and disrupt pro-tumorigenic signaling in the TME.
Core Mechanosensors: Mechanisms & Quantitative Data
Integrins
Integrins are heterodimeric transmembrane receptors that link the extracellular matrix (ECM) to the cytoskeleton. Fluid shear stress and force-dependent conformational changes (from bent to extended) expose cryptic binding sites, leading to focal adhesion kinase (FAK) and Src family kinase (SFK) activation, which promotes downstream signaling for cell adhesion, migration, and survival.
Piezo1
Piezo1 is a cation-permeable, mechanically activated ion channel. It directly senses membrane tension induced by fluid flow, allowing Ca²⁺ influx. This rapid ionic signal triggers diverse pathways, including calpain activation, cytoskeletal remodeling, and gene expression changes.
GPCRs
Select GPCRs (e.g., LPA, S1P receptors) can act as indirect mechanosensors. Flow can alter the spatial distribution of ligands or induce conformational changes in receptors. They signal through Gαi, Gαq, and Gα12/13 proteins, regulating cell polarity, chemotaxis, and actomyosin contractility.
Table 1: Comparative Quantitative Data for Key Mechanosensors
| Parameter | Integrins | Piezo1 | GPCRs (e.g., S1PR1) |
|---|---|---|---|
| Activation Force/Shear Threshold | ~1-5 pN per bond, ~0.1-1 dyn/cm² | ~0.5-5 dyn/cm², ~1-10 mN/m membrane tension | Indirect; ligand concentration gradients (nM-µM) in flow |
| Primary Signal Output | Clustering, FAK/Src phosphorylation (Y397-FAK >10-fold increase) | Ca²⁺ influx (Δ[Ca²⁺]i ~200-500 nM) | GTPase activity, cAMP modulation (up to 80% inhibition via Gαi) |
| Key Downstream Effectors | paxillin, talin, vinculin, Rho GTPases | Calpain, PKC, NFAT, YAP/TAZ | PI3Kγ, AKT, Rac1, RhoA |
| Response Kinetics | Seconds to minutes (adhesion maturation) | Milliseconds to seconds (channel opening) | Seconds to minutes (second messenger cascades) |
| Role in Flow-Driven Immune Cell Migration | Adhesion, haptotaxis, traction force generation | Ca²⁺-dependent directionality & speed modulation | Chemotaxis, polarity, transendothelial migration |
Experimental Protocols for Flow-Mediated Signaling
Protocol: Parallel Plate Flow Chamber Assay for Integrin & Piezo1 Activation
Purpose: To apply precise laminar shear stress to cells and analyze real-time mechanosensitive signaling. Materials: Parallel plate flow chamber (e.g., µ-Slide I Luer), programmable syringe pump, live-cell imaging system, appropriate cell culture media. Procedure:
- Cell Seeding: Seed tumor-associated macrophages (TAMs) or dendritic cells on a fibronectin-coated (10 µg/mL, 2h) glass slide at 80% confluency. Culture overnight.
- Dye Loading (for Piezo1/Ca²⁺): Incubate cells with 5 µM Fluo-4 AM in HBSS for 30 min at 37°C. Wash and incubate in fresh media for 20 min.
- Flow Setup: Assemble flow chamber. Connect to pump via tubing. De-gas media to prevent bubbles.
- Shear Application: Initiate flow to achieve desired shear stress (τ). τ (dyn/cm²) = (6μQ)/(wh²), where μ= viscosity (Poise), Q= flow rate (mL/s), w= chamber width, h= height.
- For low interstitial flow: Apply 0.1-0.5 dyn/cm².
- For high shear studies: Apply up to 10 dyn/cm².
- Live Imaging: Acquire images for Ca²⁺ fluorescence (Ex/Em: 494/506 nm) every 2s. For integrin activation, fix cells post-flow and immunostain for p-FAK (Y397).
- Analysis: Quantify Ca²⁺ spike frequency. Analyze p-FAK polarization in the direction of flow.
Protocol: Boyden Chamber Assay under Interstitial Flow Conditions
Purpose: To decouple chemotaxis from haptotaxis and flow-driven mechanotaxis. Materials: Modified Boyden chamber (Transwell), chemoattractant (e.g., CCL21, 100 ng/mL), pump to generate hydrostatic pressure gradient. Procedure:
- Setup: Place collagen I-coated (1 mg/mL) porous membrane (5 µm pores) in Transwell. Add serum-free media to top (upper chamber) and bottom (lower chamber).
- Gradient Generation: Add chemoattractant to lower chamber. Use a pump to recirculate lower chamber media, creating a consistent ~0.3 dyn/cm² pressure-driven flow across the membrane.
- Cell Migration: Seed T cells or monocytes (1x10⁵ cells) in upper chamber. Incubate at 37°C for 6-18h.
- Inhibition Studies: Pre-treat cells with: Blebbistatin (10 µM, myosin II inhibitor), Yoda1 (5 µM, Piezo1 agonist), or RGD peptide (1 mM, integrin blocker).
- Quantification: Remove non-migrated cells from top. Fix and stain migrated cells on bottom membrane with DAPI. Count cells in 5 random fields per well.
- Analysis: Compare migration rates under static vs. flow conditions with/without inhibitors.
Signaling Pathway Diagrams
Title: Core Flow-Sensing Pathways Converging on Immune Cell Migration
Title: Experimental Workflow for Flow Mechanosensing Assays
The Scientist's Toolkit: Key Research Reagent Solutions
Table 2: Essential Reagents for Mechanosensor Research in Interstitial Flow
| Reagent/Category | Example Product(s) | Function & Application |
|---|---|---|
| Piezo1 Modulators | Yoda1 (agonist), GsMTx4 (inhibitor) | To activate or inhibit Piezo1 channels specifically; used to dissect Piezo1's role in flow-induced Ca²⁺ signaling. |
| Integrin-Blocking Peptides | RGD (Arg-Gly-Asp) peptide, Cliengitide | Competitively inhibit integrin-ECM binding; used to block integrin-mediated adhesion and downstream signaling. |
| GPCR Ligands & Inhibitors | Sphingosine-1-phosphate (S1P), FTY720 (S1PR modulator), LPA | To establish chemotactic gradients or block GPCR-mediated flow sensing in migration assays. |
| Live-Cell Calcium Indicators | Fluo-4 AM, Fura-2 AM | Rationetric or intensity-based detection of real-time Ca²⁺ influx upon Piezo1 activation under flow. |
| Phosphospecific Antibodies | Anti-phospho-FAK (Y397), Anti-phospho-Src (Y418) | Detect activation of key integrin signaling nodes via immunofluorescence or western blot post-flow. |
| Flow System Components | µ-Slide I Luer (ibidi), Parallel Plate Chambers (GlycoTech) | Provide a controlled microenvironment for applying precise laminar shear stress to cultured cells. |
| Cytoskeletal Drugs | Blebbistatin (myosin II inhibitor), Latrunculin A (actin disruptor) | Probe the role of actomyosin contractility and cytoskeletal dynamics in mechanotransduction. |
| ECM Coating Proteins | Fibronectin, Collagen I (Corning), Laminin | Standardize substrate stiffness and ligand presentation for integrin binding in flow assays. |
Framing Thesis Context: This whitepaper details the mechanisms of chemokine gradient establishment within the tumor microenvironment (TME), examining the competing and synergistic roles of diffusion and interstitial fluid flow (IFF)-driven convection. This analysis is a core component of a broader thesis investigating how interstitial flow directs immune cell migration, ultimately influencing anti-tumor immunity and therapy efficacy.
Chemokine gradients are critical for directing leukocyte migration within tissues. In the TME, two primary physical forces govern gradient formation:
- Diffusion: Passive movement down a concentration gradient (Fick's Law). Dominant for small molecules over short distances.
- Convective Transport: Active transport of solutes (like chemokines) by the bulk movement of interstitial fluid (Darcy's Law). Driven by pressure gradients from leaky tumor vasculature and dysfunctional lymphatics.
The interplay between these forces determines the shape, stability, and effective range of chemokine gradients, directly impacting immune cell positioning and function.
Quantitative Comparison of Transport Mechanisms
The following table summarizes key quantitative parameters differentiating convective and diffusive transport of chemokines in the TME.
Table 1: Comparative Dynamics of Chemokine Transport Mechanisms
| Parameter | Diffusive Transport | Convective Transport (IFF-driven) |
|---|---|---|
| Governing Law | Fick's Law | Darcy's Law / Stokes Flow |
| Driving Force | Concentration Gradient | Hydrostatic Pressure Gradient |
| Typical Velocity | ~0.1 – 1 µm²/s (Diffusion Coefficient) | ~0.1 – 2 µm/s (Fluid Velocity) |
| Effective Range | Short (<200 µm) | Long (mm scale) |
| Gradient Shape | Exponential decay from source | Asymmetric, elongated downstream |
| Key TME Modulator | ECM Density (Hyaluronan, Collagen) | Vascular Permeability, Lymphatic Drainage |
| Primary Impact on Immune Cells | Localized, fine-tuning of migration | Long-distance directional guidance; Alters receptor-ligand binding (Shear) |
Key Experimental Protocols for Investigation
Protocol 1: Measuring Interstitial Flow Velocity and Direction
Title: Multiphoton Microscopy-Based Flow Tracking in Live Tumor Slices Objective: Quantify interstitial flow velocity vectors within the TME. Materials: Fluorescently labeled 70-kDa dextran (size-excluded from cells), orthotopic or implanted tumor in a window chamber model, multiphoton/confocal microscope. Procedure:
- Intravenously inject tumor-bearing mouse with 70-kDa Texas Red-dextran.
- Allow 30 mins for extravasation and distribution in interstitial space.
- Image a 3D volume (200x200x100 µm) within the tumor periphery every 10 seconds for 10 minutes.
- Use particle image velocimetry (PIV) or kymograph analysis on time-lapse sequences to track dextran movement.
- Calculate flow velocity (µm/s) and derive dominant directionality relative to blood vessels.
Protocol 2: Visualizing Chemokine Gradient Asymmetry
Title: FRET-based Chemokine Gradient Mapping Under Flow Objective: Visualize and quantify the spatial distribution of a specific chemokine (e.g., CCL21) under convective influence. Materials: CCL21 FRET biosensor-expressing stromal cells, microfluidic device mimicking interstitial flow (0.5-2 µm/s), live-cell imaging system. Procedure:
- Seed biosensor cells in the central chamber of a 3-channel microfluidic device.
- Allow cells to form a 3D matrix over 48 hours.
- Introduce purified chemokine to the upstream "vascular" channel.
- Apply a constant pressure gradient to generate defined interstitial flow across the cell chamber.
- Image FRET signal ratio (emission 535 nm / 480 nm upon 430 nm excitation) across the chamber over time.
- Compare gradient profile (steepness, symmetry) with static (diffusion-only) controls.
Protocol 3: Functional Assay for Cell Migration
Title: Microfluidic Chip Assay for Convective vs. Diffusive Guidance of T Cells Objective: Decouple the effects of chemokine diffusion and convection on CD8+ T cell migration. Materials: PDMS microfluidic chip with a central migration channel, primary murine CD8+ T cells, recombinant CXCL10, collagen type I matrix, syringe pumps. Procedure:
- Load collagen matrix into the central channel.
- Perfuse CXCL10 in medium through a side channel, with or without applied flow (1 µm/s) into the matrix.
- Load fluorescently labeled CD8+ T cells into the opposite side of the matrix channel.
- Acquire time-lapse images every 30 seconds for 3 hours under controlled temperature/CO2.
- Track cell trajectories. Calculate metrics: migration speed, directionality (cosine of angle relative to gradient source), and persistence.
Visualizing Signaling and Experimental Workflows
Diagram 1: Chemokine Gradient Sensing Mechanisms
Diagram 2: Workflow for Measuring Interstitial Flow
The Scientist's Toolkit: Key Research Reagent Solutions
Table 2: Essential Reagents for Investigating Chemokine Transport
| Item | Function & Application | Example/Notes |
|---|---|---|
| Fluorescent Tracers (70 kDa Dextran) | Size-excluded interstitial flow tracer. Used for in vivo and ex vivo PIV measurements. | ThermoFisher (D1864); Choose different fluorophores (e.g., TxRed, FITC). |
| 3D Chemotaxis/Microfluidic Chips | Platforms to establish controlled chemokine gradients with/without superimposed flow. | Ibidi µ-Slide Chemotaxis; SynVivo chips; Custom PDMS devices. |
| Recombinant Chemokines & Inhibitors | Establish defined gradients; block specific receptors (e.g., CXCR3, CCR7). | R&D Systems/PeproTech for proteins; Tocris for inhibitors (e.g., AMD3100). |
| FRET-based Chemokine Biosensors | Visualize real-time spatial distribution of specific chemokines in living tissue. | Genetically encoded (e.g., CCL21-FRET); Requires transfection/transduction. |
| Live-Cell Imaging Matrices | Physiologically relevant 3D environments for migration assays (Collagen I, Matrigel). | Corning Collagen I, high concentration (4-8 mg/mL); Growth Factor Reduced Matrigel. |
| Directionality Analysis Software | Quantify cell migration parameters (velocity, persistence, directionality). | ImageJ plugins (TrackMate, Chemotaxis Tool); Imaris (Bitplane). |
This whitepaper addresses the critical role of mechanical forces, specifically interstitial flow, in modulating immune cell function within the tumor microenvironment (TME). Interstitial flow—the convective movement of fluid through the extracellular matrix—is a key biophysical hallmark of solid tumors, often elevated due to vascular leakage and matrix remodeling. Within the context of a broader thesis on interstitial flow-driven immune cell migration, this document delves into the mechanotransduction pathways that convert these fluid shear stresses into biochemical signals, ultimately reprogramming immune cell phenotype, cytotoxic potential, and antigen presentation capabilities. Understanding these mechanisms is paramount for developing next-generation immunotherapies that can function effectively in the immunosuppressive, mechanically active TME.
Core Mechanotransduction Pathways Activated by Flow
Fluid shear stress is sensed by immune cells through primary mechanosensors, leading to downstream signaling cascades.
Primary Mechanosensors and Initial Signaling
- Integrins: Flow-induced torque and tension alter integrin conformation and clustering, facilitating the formation of mechanosensory complexes with proteins like talin and vinculin at focal adhesions.
- Ion Channels (e.g., Piezo1, TRPV4): Membrane tension directly gates these channels, causing Ca²⁺ influx, a ubiquitous secondary messenger.
- G-protein Coupled Receptors (GPCRs): Shear stress can alter GPCR conformation, initiating Gαᵢ and Gβγ signaling independently of ligand binding.
- Primary Cilia: Present on some immune cells (e.g., dendritic cell precursors), they deflect under flow, activating associated kinases.
Key Downstream Signaling Nodes
Activation of the above sensors converges on several critical pathways:
- FAK/Src/PI3K-Akt Pathway: Activated by integrin clustering, promoting cell survival, proliferation, and metabolic shifts.
- Rho/ROCK/Myosin II Pathway: Regulates actomyosin contractility, cell morphology, and migration.
- YAP/TAZ Transcriptional Co-activators: Translocate to the nucleus upon cytoskeletal tension, regulating genes involved in proliferation and anti-apoptosis.
- NF-κB and AP-1 Pathways: Often activated by integrin or calcium signals, driving pro-inflammatory gene expression.
Diagram 1: Core mechanotransduction signaling network in immune cells under flow.
Quantitative Impact of Flow on Immune Cell Parameters
Table 1: Experimental Effects of Interstitial Flow on Immune Cell Behavior
| Immune Cell Type | Flow Condition (Approx.) | Key Phenotypic/Functional Change | Quantitative Measure | Proposed Mechanotransduction Mediator |
|---|---|---|---|---|
| Cytotoxic T Lymphocyte (CTL) | 0.1-0.5 dyn/cm², 24h | Enhanced Cytotoxicity | ↑ 40-60% target cell lysis | Piezo1, Integrin α₅β₁, FAK |
| 0.5 dyn/cm², 48h | Altered Differentiation | ↑ T-bet/Tim-3 (Effector/Exhaustion) | YAP/TAZ, Ca²⁺ | |
| Natural Killer (NK) Cell | 0.05-0.2 dyn/cm², 12h | Increased Degranulation | ↑ 30% CD107a expression | Piezo1, TRPV4 |
| 0.2 dyn/cm², 24h | Cytokine Production | ↑ 2.5-fold IFN-γ secretion | Integrin β₂, ROCK | |
| Dendritic Cell (DC) | 0.1-0.3 dyn/cm², 18h | Maturation Marker Upregulation | ↑ 3-fold CD86/CD83 expression | Integrin αᵥβ₅, NF-κB |
| 0.3 dyn/cm², 24h | Enhanced Antigen Uptake/Capture | ↑ 50-80% dextran/OVA uptake | Rac1, Actin Polymerization | |
| Macrophage | 0.2 dyn/cm², 48h | Pro-Inflammatory Polarization | ↑ iNOS/Arg-1 ratio (M1-like) | TLR4/Piezo1 crosstalk, NF-κB |
| High Laminar Flow (10 dyn/cm²) | Anti-Inflammatory Polarization | ↑ CD206/TGF-β (M2-like) | KLF2/4 transcription factors |
Detailed Experimental Protocols
Protocol: Assessing T Cell Cytotoxicity Under Simulated Interstitial Flow
Objective: To quantify the change in specific lysis capacity of CD8⁺ T cells after exposure to physiological interstitial flow shear stress. Materials: See "Scientist's Toolkit" below. Method:
- T Cell Activation & Culture: Isolate human CD8⁺ T cells from PBMCs using magnetic beads. Activate with anti-CD3/CD28 beads and expand in IL-2 (100 IU/mL) for 5 days.
- Flow Conditioning: Seed activated T cells into the central channel of a µ-Slide I 0.4 Luer (Ibidi) coated with ICAM-1 (1 µg/mL). Connect the slide to a programmable syringe pump via tubing. Culture under static conditions or expose to a continuous, unidirectional flow of 0.3 dyn/cm² for 24-48 hours in complete RPMI.
- Target Cell Preparation: Label target cells (e.g., OVA-pulsed B16 melanoma or Jurkat) with CellTracker Red CMTPX dye according to manufacturer protocol.
- Cytotoxicity Co-culture: Harvest flow- and static-conditioned T cells. Co-culture with labeled target cells at various Effector:Target (E:T) ratios (e.g., 1:1 to 10:1) in a 96-well U-bottom plate for 4 hours.
- Viability Staining & Flow Cytometry: Add 7-AAD or SYTOX Green viability dye to each well 15 minutes before analysis. Acquire samples on a flow cytometer.
- Data Analysis: Calculate % Specific Lysis = [(% Dead Targets in Test – % Dead Targets Spontaneous) / (100 – % Dead Targets Spontaneous)] * 100. Compare static vs. flow-conditioned T cells.
Protocol: Evaluating Dendritic Cell Maturation and Antigen Uptake Under Flow
Objective: To measure the upregulation of co-stimulatory molecules and antigen capture efficiency in DCs under interstitial flow. Method:
- DC Generation: Differentiate human monocytes (CD14⁺) into immature DCs (iDCs) with GM-CSF (50 ng/mL) and IL-4 (20 ng/mL) for 6 days.
- Flow Chamber Setup: Seed iDCs into a parallel-plate flow chamber (e.g., GlycoTech) with a collagen I-coated glass slide. Assemble and mount on a microscope stage.
- Flow & Antigen Exposure: Perfuse the chamber with media containing a model antigen (e.g., FITC-conjugated ovalbumin, 10 µg/mL) at 0.2 dyn/cm² for 2 hours at 37°C. Use a static well with the same antigen solution as control.
- Analysis of Antigen Uptake: Stop perfusion, disassemble chamber, and harvest DCs. Analyze mean fluorescence intensity (MFI) of FITC via flow cytometry to quantify antigen internalization.
- Analysis of Maturation: Following antigen uptake under flow/static conditions, further culture cells for 16 hours in fresh media. Harvest and stain for surface markers CD80, CD86, CD83, and MHC-II. Analyze by flow cytometry.
The Scientist's Toolkit: Key Research Reagents & Materials
Table 2: Essential Tools for Interstitial Flow Immune Cell Research
| Reagent/Material | Function/Application | Example Vendor/Cat. No. |
|---|---|---|
| µ-Slide I 0.4 Luer (Ibidi) | Microfluidic slide for precise 2D flow application and live imaging. | Ibidi (80176) |
| Parallel-Plate Flow Chamber (GlycoTech) | System for applying uniform shear stress to cells on coated slides. | GlycoTech (31-001) |
| Programmable Syringe Pump | Provides precise, continuous flow for microfluidic systems. | Harvard Apparatus (70-4503) |
| Piezo1 Agonist (Yoda1) | Small molecule to chemically activate Piezo1 channels for mimicry studies. | Tocris (5586) |
| Piezo1 Inhibitor (GsMTx4) | Tarantula venom peptide; selective inhibitor of Piezo1 channel. | Alomone Labs (ST-GSMTX4) |
| Rho/ROCK Inhibitor (Y-27632) | Inhibits ROCK-mediated actomyosin contractility to probe pathway. | Cayman Chemical (10005583) |
| FAK Inhibitor (PF-573228) | Selective ATP-competitive inhibitor of FAK phosphorylation. | Tocris (3239) |
| Fluorescent Cell Linker (e.g., CellTracker) | For stable, non-transferable labeling of target cells in cytotoxicity assays. | Thermo Fisher Scientific (C34552) |
| Recombinant Human ICAM-1/CD54 | Coating protein to provide adhesion substrate in flow channels. | R&D Systems (720-IC) |
| Calcium Indicator Dye (Fluo-4 AM) | To visualize real-time intracellular Ca²⁺ flux upon flow onset. | Thermo Fisher Scientific (F14201) |
Diagram 2: Generalized workflow for immune cell flow experiments.
Modeling the Current: Techniques to Recreate and Study Flow-Driven Migration
Within the context of a broader thesis on interstitial flow and immune cell migration in the tumor microenvironment (TME), the need for physiologically relevant in vitro models is paramount. Traditional 2D cultures fail to recapitulate the dynamic, three-dimensional, and mechanically active niche of a tumor. In vitro microfluidic platforms, including commercial products like the ibidi μ-slide and bespoke organ-on-a-chip (OoC) systems, offer unprecedented control over biophysical and biochemical cues to mimic key TME features. This technical guide outlines the core design principles for constructing such platforms to study TME-driven phenomena, particularly interstitial flow-mediated immune cell recruitment and behavior.
Core Design Principles for TME Mimicry
Architectural & Geometrical Design
The platform architecture must emulate the in vivo spatial organization and scale.
- Compartmentalization: Separate yet interconnected channels or chambers to represent distinct TME compartments (e.g., vascular channel, stromal region, tumor spheroid compartment).
- Scale Fidelity: Channel dimensions (typically 50-500 µm in width/height) should match the scale of microvessels and interstitial spaces.
- 3D Matrix Integration: Provision for housing hydrogel matrices (e.g., collagen, Matrigel) in a central chamber to model the extracellular matrix (ECM).
Biophysical Cue Integration
- Interstitial Flow Control: Precise pressure- or pump-driven generation of physiological interstitial flow (0.1-3.0 µm/s). This is critical for studying chemokine transport and haptotactic guidance of immune cells.
- Mechanical Stiffness: Use of tunable hydrogels to mimic the increased stiffness of tumor-associated ECM (0.5-10 kPa range).
- Fluidic Shear Stress: Application of relevant shear stresses in endothelialized "vessel" channels (0.5-4 dyn/cm² for capillaries).
Biochemical & Cellular Fidelity
- Cellular Cohabitation: Co-culture of relevant cell types: endothelial cells, cancer-associated fibroblasts (CAFs), immune cells (T cells, macrophages), and tumor cells (as spheroids or dispersed).
- Soluble Factor Gradients: Generation of stable, flow-based chemokine (e.g., CXCL12, CCL21) or drug concentration gradients.
Key Experimental Protocols for TME-Interstitial Flow Studies
Protocol 1: Establishing an Endothelial Barrier with Interstitial Flow for Immune Cell Transmigration
Objective: To model immune cell extravasation from a simulated vessel into a tumor-embedded 3D matrix under interstitial flow.
Materials: ibidi µ-Slide VI 0.4 or equivalent OoC device, human umbilical vein endothelial cells (HUVECs), fluorescently labeled T cells, tumor cell spheroids, type I collagen gel, cell culture medium, syringe pump, confocal microscope.
Methodology:
- Chip Preparation: Sterilize the microfluidic chip (UV or 70% ethanol).
- Hydrogel Loading: Mix tumor spheroids with neutralized collagen I solution (4 mg/mL). Pipette the mixture into the central matrix chamber, avoiding introduction into side channels. Incubate at 37°C for 30 min for polymerization.
- Endothelial Seeding: Introduce HUVEC suspension (~2x10^6 cells/mL) into one side channel (the "vessel" channel). Allow cells to attach for 15 min, then flip the chip and seed the opposite side of the same channel. Culture under static conditions for 48-72 hours to form a confluent monolayer.
- Flow Application: Connect the chip to a syringe pump via tubing. Apply a low, continuous flow of medium through the endothelial channel (generating 0.5-1 dyn/cm² shear). Simultaneously, apply a hydrostatic pressure drop across the matrix chamber (using unequal reservoir heights) to initiate interstitial flow (target ~0.5 µm/s).
- Immune Cell Recruitment: Introduce fluorescent T cells into the endothelial channel inlet. Monitor and image transmigration and migration within the matrix towards the tumor spheroid over 6-24 hours using time-lapse confocal microscopy.
- Quantification: Analyze parameters such as transmigration rate, migration velocity, and directionality relative to the flow vector.
Protocol 2: Profiling Chemokine Gradient Generation under Flow
Objective: To quantify the establishment of a chemokine gradient within a 3D matrix under controlled interstitial flow.
Materials: OoC with a central gel chamber and two parallel media channels, FITC-dextran (40 kDa, simulates chemokine), type I collagen, fluorescence microscope, image analysis software (e.g., ImageJ).
Methodology:
- Load neutralized collagen into the central chamber and allow it to polymerize.
- Fill one side channel with medium containing FITC-dextran (the "source"). Fill the other side channel with plain medium (the "sink").
- Apply a hydrostatic pressure difference (e.g., 2-4 mm H₂O) between the source and sink channels to drive interstitial flow across the matrix.
- Acquire time-lapse fluorescence images of the entire matrix region at regular intervals.
- Measure fluorescence intensity profiles across the width of the matrix (from source to sink) over time. Plot intensity versus distance to visualize gradient establishment and steady-state.
Table 1: Key Biophysical Parameters in Microfluidic TME Models
| Parameter | Physiological Range in vivo (TME) | Typical Microfluidic Platform Range | Measurement Technique in Chip |
|---|---|---|---|
| Interstitial Flow Velocity | 0.1 - 3.0 µm/s | 0.1 - 5.0 µm/s | Fluorescent bead tracking, FRAP |
| Interstitial Pressure | 5 - 40 mmHg (high in tumors) | N/A (gradient controlled) | Pressure sensor integration |
| Matrix Stiffness (Young's Modulus) | ~0.5 kPa (normal) to >4 kPa (tumor) | 0.2 - 15 kPa | Tunable hydrogel composition |
| Capillary Shear Stress | 0.5 - 4 dyn/cm² | 0.1 - 10 dyn/cm² | Calculated from flow rate & geometry |
| Gradient Stability | Hours to days | Can be maintained for days | Fluorescence profiling |
Table 2: Common Commercial Microfluidic Platforms for TME Research
| Platform (Example) | Key Feature for TME | Best Suited For | Throughput |
|---|---|---|---|
| ibidi µ-Slide VI 0.4 | Angiogenesis/chemotaxis; precise gradient generation | High-resolution imaging of 3D cell migration | Medium (6 channels/slide) |
| Emulate Organ-Chip | Mechanically active membranes; physiological shear stress | Vascular- stromal-tumor interactions, barrier function | Low to Medium |
| AIM Biotech 3D Culture Chip | Easy 3D gel loading; compartmentalized design | Drug penetration assays, cancer cell invasion | High (96-chip plates) |
| MIMETAS OrganoPlate | Gravity-driven flow; 40+ chips per plate | High-content screening of TME-targeting therapies | Very High |
The Scientist's Toolkit: Research Reagent Solutions
Table 3: Essential Materials for TME-on-Chip Experiments
| Item | Function in TME Mimicry | Example Product/Type |
|---|---|---|
| Tunable Hydrogel | Provides 3D, biomechanically relevant ECM for cell embedding and migration. | Collagen I (rat tail), Fibrin, Matrigel, Hyaluronic acid-based (e.g., HyStem) |
| ECM Modifying Enzymes | To mimic matrix remodeling by CAFs or tumor cells. | Collagenase, Hyaluronidase, MMP-2/9 |
| Chemokine/Cytokine Cocktails | To establish recruitment gradients for specific immune subsets. | Recombinant human CXCL12, CCL2, CCL21, TGF-β |
| Fluorescent Cell Trackers | For live-cell tracking of immune cell migration. | CellTracker CMFDA, CM-Dil, CFSE |
| Perfusion Set | Enables precise application of interstitial and luminal flow. | Syringe pumps (neMESYS), gas-permeable tubing, sterile reservoirs |
| Occlusion Clips | For controlling fluidic access and creating pressure differences. | Microfluidic pinch valves or manual clips |
Visualization Diagrams
Diagram 1: Logic Map from TME Features to Chip Design and Outputs
Diagram 2: Immune Cell Transmigration Assay Workflow
Diagram 3: Interstitial Flow Mediated T Cell Chemotaxis
The investigation of the tumor microenvironment (TME) is critical for understanding cancer progression and therapy resistance. This whitepaper frames 3D hydrogel and spheroid models within the broader thesis of interstitial flow-mediated immune cell migration in the TME. Interstitial flow, the convective movement of fluid through extracellular matrix (ECM), is a key physical driver of chemokine gradients, cell migration, and stromal-immune-tumor interactions. Traditional 2D cultures fail to recapitulate these dynamics. Advanced 3D models incorporating biomechanically relevant hydrogels and heterotypic spheroids are therefore essential for dissecting these mechanisms and developing effective immunotherapies.
Core Principles and Model Design
Hydrogels as Synthetic and Natural ECM
Hydrogels provide a hydrated, porous 3D network that mimics native tissue. Their properties—stiffness, ligand density, degradability, and porosity—can be precisely tuned to match specific tissue contexts.
Key Hydrogel Systems:
- Natural: Collagen I, Matrigel, fibrin, hyaluronic acid (HA). Provide native bioactivity but have batch variability.
- Synthetic: Poly(ethylene glycol) (PEG), polyacrylamide. Offer high tunability and reproducibility.
- Hybrid: PEG-RGD, HA-methacrylate. Combine tunability with bioactive motifs.
Incorporating Stromal Components
Stromal cells (e.g., cancer-associated fibroblasts (CAFs), mesenchymal stem cells (MSCs), endothelial cells) are co-cultured with tumor cells to model paracrine signaling and physical interactions. They can be added as dispersed cells within the hydrogel or as pre-formed spheroids.
Interstitial Flow Integration
Interstitial flow is applied using microfluidic devices (e.g., pump-driven or gravity-driven systems) to perfuse media through the 3D hydrogel construct, generating physiological pressure gradients (0.1–3 µm/s).
Table 1: Properties of Common Hydrogel Systems for TME Modeling
| Hydrogel Type | Typical Stiffness Range (kPa) | Key Advantages | Limitations | Primary Use Case in TME |
|---|---|---|---|---|
| Collagen I | 0.2 - 5 | Native ECM, cell-mediated remodeling | Batch variability, low stiffness range | Stromal invasion, CAF-tumor interactions |
| Matrigel | ~0.5 | Rich in basement membrane proteins | Complex composition, animal origin | Epithelial morphogenesis, angiogenesis |
| Fibrin | 0.5 - 10 | Injectable, high cell adhesion | Fast degradation, hemostasis context | Vascular network formation |
| Hyaluronic Acid | 1 - 20 | Tunable, mimics desmoplastic TME | Requires modification for stability | Modeling HA-rich tumors (e.g., breast) |
| PEG | 1 - 100+ | Highly tunable, inert background | Requires adhesive motifs (e.g., RGD) | Mechanotransduction studies |
Table 2: Impact of Interstitial Flow on Key Parameters in 3D Models
| Parameter | Static 3D Culture | With Interstitial Flow (0.5-2 µm/s) | Measured Outcome / Assay |
|---|---|---|---|
| Immune Cell (T cell) Infiltration Depth | Limited (<200 µm) | Increased (up to 500-1000 µm) | Confocal microscopy of fluorescently labeled cells |
| Chemokine (e.g., CXCL12) Gradient | Diffuse, symmetric | Polarized, sustained | FRET-based biosensor imaging, ELISA of effluent |
| Tumor Spheroid Growth Rate | Baseline | Often reduced | Volume measurement (brightfield/fluorescence) |
| Drug Penetration (e.g., Doxorubicin) | Poor in core | Enhanced distribution and efficacy | LC-MS/MS on sectioned spheroid, viability assay |
Experimental Protocols
Protocol 1: Generation of Heterotypic Tumor Spheroids with CAFs for Hydrogel Embedding
Objective: Create uniform, reproducible spheroids containing tumor cells and CAFs. Materials: Tumor cell line (e.g., MCF-7), primary human CAFs, ultra-low attachment (ULA) 96-well round-bottom plates, co-culture medium. Steps:
- Cell Preparation: Harvest tumor cells and CAFs. Mix at desired ratio (e.g., 70:30 tumor:CAF) in medium. Centrifuge and resuspend to a final concentration of 1-2 x 10^4 cells per spheroid in 200 µL.
- Spheroid Formation: Pipette 200 µL of cell suspension into each well of a ULA plate. Centrifuge the plate at 300 x g for 3 minutes to aggregate cells at the well bottom.
- Culture: Incubate at 37°C, 5% CO2 for 48-72 hours. Spheroids will self-assemble.
- Harvesting: Gently pipette medium containing formed spheroids into a conical tube. Let spheroids settle by gravity (5-10 min).
Protocol 2: Embedding Spheroids in a Tunable Collagen I Hydrogel for Flow Studies
Objective: Encapsulate spheroids in a biomechanically relevant 3D matrix for microfluidic perfusion. Materials: Rat tail Collagen I (high concentration, ~8-10 mg/mL), 10X PBS, 0.1N NaOH, neutralization buffer, spheroids from Protocol 1. Steps:
- Collagen Neutralization: Keep all components on ice. In a chilled tube, mix:
- 400 µL Collagen I stock
- 50 µL 10X PBS
- 10 µL 0.1N NaOH (adjust volume for final pH ~7.4)
- Add cell culture medium to bring total volume to 500 µL. Mix gently.
- Spheroid Incorporation: Gently pellet 20-50 spheroids. Aspirate supernatant. Resuspend spheroid pellet in 100 µL of neutralized collagen solution.
- Gelation: Quickly pipette the spheroid-collagen mix into the central chamber of a prepared microfluidic device or a Lab-Tek chamber. Transfer to 37°C incubator for 30-45 minutes for full polymerization.
- Media Addition: After gelation, gently add culture medium to the reservoir channels.
Protocol 3: Applying Interstitial Flow in a Microfluidic Device and Assessing Immune Cell Migration
Objective: Establish interstitial flow and quantify consequent immune cell migration towards a tumor spheroid. Materials: 3-lane microfluidic device (e.g., µ-Slide VI 0.4 from ibidi), syringe pump, T cells (e.g., primary CD8+ or Jurkat), fluorescent cell tracker dye. Steps:
- Device Preparation: Embed a tumor-CAF spheroid in collagen in the central gel channel as per Protocol 2. Let it stabilize overnight.
- Immune Cell Loading: Label T cells with CellTracker Green. Resuspend at 1 x 10^6 cells/mL in medium. Add this suspension to one reservoir channel (the "inlet").
- Flow Setup: Add medium without cells to the opposite reservoir ("outlet"). Connect the inlet reservoir to a syringe pump via tubing. Set the pump to generate a flow rate that results in an interstitial velocity of ~1 µm/s across the gel channel (requires calibration based on device geometry).
- Migration Assay: Run flow for 12-48 hours. Use live-cell imaging (confocal microscope with environmental chamber) to capture time-lapse images every 30 minutes.
- Analysis: Track individual cell trajectories. Calculate metrics: migration speed, directionality (persistence), and Euclidean distance traveled towards the spheroid.
Diagrams
Diagram 1: Interstitial Flow Drives Immune Cell Migration in TME
Diagram 2: 3D Spheroid-Hydrogel Interstitial Flow Assay Workflow
The Scientist's Toolkit: Research Reagent Solutions
Table 3: Essential Materials for 3D TME Models with Interstitial Flow
| Item | Function in Experiment | Example Product / Note |
|---|---|---|
| Ultra-Low Attachment (ULA) Plates | Enables self-assembly of cells into 3D spheroids by preventing adhesion. | Corning Spheroid Microplates, Nunclon Sphera plates. |
| Basement Membrane Extract (BME/Matrigel) | Natural hydrogel providing a complex ECM environment for epithelial/stromal co-culture. | Corning Matrigel (Growth Factor Reduced for controlled studies). |
| Type I Collagen, High Concentration | Tunable natural hydrogel for modeling stromal-rich tissue; allows cell-mediated remodeling. | Rat tail Collagen I, 8-10 mg/mL (Corning, Advanced BioMatrix). |
| PEG-based Crosslinker (e.g., 4-Arm PEG-NHS) | Synthetic hydrogel precursor for creating matrices with defined mechanical properties. | JenKem Technology PEG derivatives (amine-reactive for peptide conjugation). |
| RGD Peptide | Cell-adhesive motif conjugated to synthetic hydrogels (e.g., PEG) to promote integrin binding. | Cyclo(Arg-Gly-Asp-D-Phe-Cys) (standard for αvβ3/β5 integrins). |
| Microfluidic Device (3-lane) | Platform for hydrogel embedding and application of controlled interstitial flow. | ibidi µ-Slide VI 0.4, AIM Biotech DAX-1 chip. |
| Syringe Pump | Provides precise, continuous flow for generating interstitial pressure gradients. | Harvard Apparatus Pico Plus, neMESYS low-pressure pumps. |
| Live-Cell Imaging Dyes | For tracking immune cell migration and viability in 3D over time. | CellTracker Green CMFDA, CellEvent Caspase-3/7 (Apoptosis). |
| Matrix Metalloproteinase (MMP) Substrate | Fluorescent peptide to visualize local protease activity in the hydrogel during invasion. | Mca-PLGL-Dpa-AR-NH2 (FRET-based, cleaved by MMP-2/9). |
Within the broader thesis on interstitial flow and immune cell migration in the tumor microenvironment (TME), quantitative live-cell imaging and tracking is a cornerstone methodology. It enables the precise measurement of immune cell (e.g., T cells, dendritic cells, macrophages) migratory responses to biophysical (e.g., interstitial flow, ECM stiffness) and biochemical (e.g., chemokine gradients) cues present in the TME. This technical guide details the core metrics, protocols, and analytical frameworks necessary to derive biologically and therapeutically relevant insights from cell migration data.
Core Metrics for Migration Analysis
Cell tracking software (e.g., TrackMate, Imaris, CellProfiler) generates raw coordinate data over time. From these, quantitative descriptors are calculated. The table below summarizes the primary metrics, categorized by aspect of migration.
Table 1: Core Quantitative Metrics for Cell Migration Analysis
| Metric | Formula / Description | Biological Interpretation in TME Context |
|---|---|---|
| Speed/Velocity | ||
| Instantaneous Speed | v(t) = Δd / Δt (between consecutive frames) | Measures motile activity; can reveal rapid responses to local cues. |
| Mean Speed / Velocity | <*v*> = Total Path Length / Total Time | Overall migratory potential. Altered by interstitial flow or chemotactic signals. |
| Persistence | ||
| Persistence Time (P) | Fitted from MSD curve (see below) or from autocorrelation of velocity. | Time scale a cell maintains direction. High persistence indicates directed migration (e.g., chemotaxis). |
| Persistence Length | L_p = P * |
Mean linear distance traveled before direction change. |
| Straightness / Confinement Ratio | Net Displacement / Total Path Length (0-1) | 1 indicates perfectly linear migration (e.g., towards a tumor). Low values indicate exploratory or confined migration. |
| Directionality | ||
| Directedness/Chemotactic Index | Cosine of angle relative to gradient or flow direction. | Quantifies accuracy of chemotaxis or rheotaxis in response to TME gradients. |
| Mean Squared Displacement (MSD) | MSD(τ) = < [r(t+τ) - r(t)]² > | Fundamental measure of exploration. |
| MSD Model Fitting | Anomalous Diffusion: MSD(τ) = 4Dτ^α | α = 1: Normal diffusion (random). α > 1: Superdiffusive (persistent). α < 1: Subdiffusive (confined). TME ECM often induces subdiffusion. |
| Turn Analysis | ||
| Turning Angle Distribution | Angular change between movement steps. | Reveals if turns are biased (away from/toward stimulus). |
| Collective Parameters | ||
| Velocity Correlation | Spatial correlation of velocities between nearby cells. | Indicates cooperative migration or community effects. |
Experimental Protocol: Immune Cell Migration under Interstitial Flow
This protocol outlines a method for quantifying immune cell migratory response to interstitial flow in a 3D collagen matrix, mimicking key TME conditions.
Aim: To measure the effect of interstitial flow velocity on T cell migration persistence and speed.
Materials & Reagent Solutions:
Table 2: Research Reagent Solutions Toolkit
| Item | Function & Specification |
|---|---|
| Ibidi μ-Slide VI 0.4 or BioFlux System | Microfluidic plate for establishing stable, laminar interstitial flow across a 3D gel channel. |
| Type I Collagen, High Concentration (e.g., 8-10 mg/mL) | ECM hydrogel to mimic the physical and structural properties of tumor stroma. |
| Fluorescently Labeled Human T Cells (e.g., CellTracker CMFDA) | Enables high-contrast, viable cell tracking for duration of experiment. |
| Complete Immunoassay Medium (with low serum ≤2% FBS) | Provides necessary nutrients without inhibiting chemokine function or inducing excessive basal motility. |
| Recombinant Chemokines (e.g., CXCL12) | To establish a stable chemical gradient; key TME chemokine. |
| Live-Cell Imaging Incubator (Stage-top with CO₂ & temp control) | Maintains cell viability during extended time-lapse imaging (12-24h). |
| Confocal or High-Content Spinning Disk Microscope | Enables optical sectioning to track cells in 3D without phototoxicity. |
| TrackMate (Fiji) or Imaris Tracking Software | For automated cell detection and trajectory reconstruction. |
| Custom MATLAB or Python Scripts (e.g., for MSD, persistence) | For advanced metric calculation and statistical modeling of tracked data. |
Detailed Protocol:
- Gel and Cell Preparation: Mix neutralized Type I collagen solution with fluorescently labeled T cells to a final density of 2-5x10⁵ cells/mL and collagen concentration of 4 mg/mL. Pipette into the central gel channel of the μ-Slide.
- Polymerization: Incubate slide at 37°C for 30 min to allow collagen polymerization.
- Flow Setup: Fill reservoirs with warm medium. For gradient studies, add chemokine (e.g., 100 ng/mL CXCL12) to the upstream reservoir. Connect slide to a programmable syringe pump.
- Flow Application: Initiate interstitial flow at defined physiological shear stresses (0.1 - 2 dyn/cm², corresponding to ~0.1 - 5 μm/s fluid velocity in the gel).
- Imaging: Place slide on pre-warmed stage. Acquire z-stacks (e.g., 3-5 slices, 10 μm spacing) every 2-3 minutes for 12-18 hours using a 10x air or 20x water immersion objective.
- Control: Perform parallel experiment with no flow (static control) and flow without chemokine gradient.
Data Processing and Analysis Workflow
Diagram 1: Live Cell Tracking Analysis Workflow
Signaling Pathways Modulating Migration in the TME
Interstitial flow and chemokine gradients integrate to direct immune cell migration via specific mechano- and chemosensing pathways.
Diagram 2: Signaling Integration for Migration in TME
Advanced Analysis: Interpreting MSD and Persistence
Mean Squared Displacement Analysis: Fitting the MSD curve to the equation MSD(τ) = 4Dτ^α is critical. In the TME:
- Normal Diffusion (α ≈ 1): Characteristic of unguided, random motility in isotropic environments.
- Superdiffusion / Persistent (α > 1): Indicates directed, ballistic motion. Expected in strong chemotactic gradients or when cells undergo persistent interstitial flow-driven rheotaxis.
- Subdiffusion / Confined (α < 1): Suggests movement is hindered by physical barriers (dense ECM, other cells) or tethering, common in desmoplastic tumors.
Table 3: Example MSD Fitting Data from Simulated TME Conditions
| Experimental Condition | Diffusion Coefficient (D) [μm²/s] | Anomalous Exponent (α) | Implied Migratory Mode in TME |
|---|---|---|---|
| Static, No Gradient | 5.2 ± 0.8 | 0.85 ± 0.05 | Subdiffusive; ECM pore confinement. |
| +CXCL12 Gradient (Static) | 8.7 ± 1.2 | 1.3 ± 0.1 | Superdiffusive; directed chemotaxis. |
| Interstitial Flow Only (2 μm/s) | 6.5 ± 1.0 | 1.4 ± 0.15 | Superdiffusive; flow-guided rheotaxis. |
| Flow + CXCL12 Gradient | 10.1 ± 1.5 | 1.6 ± 0.2 | Highly persistent; synergistic guidance. |
Quantitative live-cell imaging and tracking provides an indispensable, high-resolution lens through which to study immune cell migration in the complex setting of the tumor microenvironment. By applying rigorous metrics such as persistence, MSD analysis, and directional indices within controlled microfluidic setups that model interstitial flow and gradients, researchers can decode the biophysical rules governing immune cell trafficking. This quantitative framework is essential for testing hypotheses within a thesis on TME migration and for identifying potential therapeutic strategies to enhance or inhibit specific migratory behaviors in disease.
Computational Fluid Dynamics (CFD) has emerged as a pivotal tool for modeling the complex biomechanical forces within the tumor microenvironment (TME). A critical component of this landscape is interstitial flow—the slow movement of fluid through the extracellular matrix (ECM). This flow generates shear stresses and pressure gradients that significantly influence immune cell migration, distribution, and function. Understanding these patterns is essential for developing strategies to enhance immunotherapy efficacy and predict drug delivery. This technical guide details the application of CFD to model these phenomena within the context of interstitial flow-driven immune cell migration in tumors.
Core Quantitative Data from Recent Studies
Table 1: Key Parameters for Interstitial Flow Modeling in Solid Tumors
| Parameter | Typical Range / Value | Significance / Impact |
|---|---|---|
| Interstitial Flow Velocity | 0.1 – 2.0 µm/s | Drives chemokine gradient formation; directs dendritic and T cell migration. |
| Interstitial Fluid Pressure (IFP) | 5 – 40 mmHg (core), ~0 mmHg (periphery) | Creates a barrier to drug and cell delivery; high in tumor core. |
| Wall Shear Stress on Cells | 0.01 – 1.0 Pa (0.1 – 10 dyn/cm²) | Mechanotransduction trigger; affects immune cell adhesion and activation. |
| Hydraulic Conductivity (K) | 10⁻¹³ – 10⁻¹¹ m²/Pa·s | Describes tissue permeability; dictates flow resistance. |
| ECM Porosity | 0.1 – 0.5 | Volume fraction available for flow; affects flow paths and solute transport. |
| Lymphatic Drainage Sink Pressure | ~0 mmHg (approximation) | Boundary condition facilitating outward flow from tumor periphery. |
Table 2: Impact of Shear Stress on Key Immune Cell Behaviors
| Cell Type | Shear Stress Range (Pa) | Observed Response (In Vitro/In Silico) |
|---|---|---|
| Cytotoxic T Lymphocytes (CTLs) | 0.05 – 0.5 | Altered migration persistence; upregulated integrin activation. |
| Dendritic Cells (DCs) | 0.1 – 0.8 | Directed upstream migration (rheotaxis); enhanced CCR7-dependent chemotaxis. |
| Natural Killer (NK) Cells | 0.2 – 1.0 | Increased adhesion to activated endothelium under flow. |
| Tumor-Associated Macrophages (TAMs) | 0.01 – 0.2 | M2-like polarization promoted by sustained low shear. |
Detailed CFD Experimental Protocol for TME Interstitial Flow
Protocol: Multi-Scale Geometry Reconstruction and Meshing
- Geometry Acquisition: Obtain 3D geometry of a tumor region. Sources can include:
- In vivo imaging (e.g., multiphoton microscopy of mouse tumors, segmented for vessel and tumor boundary).
- In vitro microfluidic device designs (e.g., from CAD software).
- Synthetic, biologically representative models (e.g., a porous sphere representing tumor core surrounded by a normal tissue shell).
- Domain Definition: Clearly define fluid (interstitial space) and solid (cells, ECM fibers) domains. For porous media approaches, the entire domain is treated as fluid-saturated porous tissue.
- Mesh Generation: Create an unstructured computational mesh with high refinement near vessel walls and cell surfaces where shear stress gradients are steep. Use mesh independence studies to ensure results are not grid-dependent.
Protocol: Physics Setup and Boundary Condition Configuration
- Governing Equations: Apply the incompressible Navier-Stokes equations, often simplified to the Stokes flow regime (Re << 1), coupled with a Darcy term for porous media resistance:
∇·u = 0andρ(∂u/∂t + u·∇u) = -∇p + μ∇²u - (μ/K)uwhereuis velocity,pis pressure,ρis density,μis viscosity, andKis hydraulic conductivity. - Boundary Conditions:
- Inflow: Set a fixed pressure (high IFP, e.g., 20 mmHg) at the tumor core boundary or a velocity inlet based on measured efflux.
- Outflow: Set a fixed pressure (low, e.g., 0-5 mmHg) at the tumor periphery or functional lymphatic vessels.
- Walls: No-slip condition (velocity = 0) at vessel walls and impermeable tissue boundaries.
- Material Properties: Assign values from Table 1 (e.g., viscosity of interstitial fluid ~1.2 cP, spatially varying hydraulic conductivity).
Protocol: Solver Execution and Post-Processing
- Solver: Use a finite volume or finite element solver (e.g., ANSYS Fluent, COMSOL, OpenFOAM). Employ a pressure-based, steady-state solver initially.
- Convergence Monitoring: Run simulation until residuals for continuity and momentum equations fall below 10⁻⁵.
- Post-Processing:
- Visualization: Generate vector plots for flow patterns and contour plots for shear stress and pressure distributions.
- Quantification: Export data along lines or surfaces to calculate average shear stress on simulated cell membranes, flow rates across specific boundaries, and pressure gradients.
Title: CFD Simulation Workflow for Interstitial Flow
Signaling Pathways Modulated by Interstitial Flow Shear Stress
Title: Flow Shear Stress Signaling in Immune Cells
The Scientist's Toolkit: Research Reagent Solutions
Table 3: Essential Materials for Coupled CFD and Biological Validation Experiments
| Item / Reagent | Function / Application in TME Flow Research |
|---|---|
| 3D Collagen I / Matrigel Matrices | Physiologically relevant ECM for in vitro interstitial flow chamber experiments; tunable stiffness and porosity. |
| Microfluidic Platforms (e.g., µ-Slide VI) | Pre-fabricated chips for creating controlled, laminar interstitial flow across cell-laden hydrogels. |
| Live-Cell Imaging-Compatible Incubators | Maintain physiological conditions during time-lapse microscopy of cell migration under flow. |
| Fluorescent Beads (0.1-2 µm) | Tracers for Particle Image Velocimetry (PIV) to measure experimental flow fields for CFD validation. |
| Shear-Activatable Dyes (e.g., Fluo-4) | Chemical sensors that indicate intracellular calcium flux, a rapid response to shear stress. |
| CCR7 Ligand (CCL19/21) | Key chemokine used in gradient generation to study synergy between chemotaxis and rheotaxis. |
| Inhibitors (e.g., PP2 for Src, LY294002 for PI3K) | Pharmacological tools to dissect mechanosignaling pathways predicted by CFD models. |
| Transwell / Boyden Chamber Assays with Flow | Modified setups to quantify leukocyte migration rates across endothelial barriers under shear. |
The efficacy of immunomodulators, particularly immune checkpoint inhibitors (ICIs), is intrinsically linked to dynamic cell-cell interactions and the physical forces present within the tumor microenvironment (TME). A critical but often overlooked component is interstitial flow—the slow movement of fluid through the extracellular matrix. This flow generates biomechanical and biochemical cues that significantly alter immune cell migration, endothelial permeability, and the spatial distribution of signaling molecules. Static in vitro assays fail to capture these dynamics, leading to poor predictive value for clinical outcomes. This whitepaper establishes a technical framework for integrating physiologic flow conditions into drug screening platforms, enabling the evaluation of immunomodulators in a context that mirrors the interstitial flow conditions of the TME. This approach is essential for a thesis focused on dissecting how flow-mediated mechanisms influence immune cell trafficking and function, ultimately impacting therapeutic response.
Core Principles: Why Flow Matters in ICI Screening
Under interstitial flow (0.1–3.0 µm/s), key phenomena affecting drug response include:
- Chemokine Gradient Remodeling: Flow creates long-range, directional gradients of cytokines (e.g., CXCL12, CCL21) that guide dendritic cell and T-cell migration.
- Shear Stress Signaling: Low shear stress activates mechanosensitive pathways (e.g., Piezo1, VEGFR2 integrin activation) in endothelial and immune cells, altering adhesion molecule expression.
- Convective Transport: Flow enhances the distribution of large therapeutic antibodies (e.g., anti-PD-1, anti-CTLA-4) but can also wash out autocrine signals, changing the perceived potency of drugs.
- Compartmentalization: Flow systems can physically separate tumor, stromal, and immune compartments, modeling the spatial heterogeneity of the TME and allowing study of drug penetration.
Table 1: Comparative Metrics for ICI Evaluation Under Flow vs. Static Conditions
| Metric | Static Transwell / Co-culture | Flow-Based System (e.g., Microfluidic) | Biological Implication |
|---|---|---|---|
| T-cell Tumor Infiltration Rate | 1-5% of seeded cells | 10-25% of seeded cells | Flow establishes haptotactic/chemotactic gradients critical for active migration. |
| IC50 for anti-PD-1 (nM) | 20-50 nM (often higher) | 5-15 nM (often lower) | Convective delivery and physiological binding kinetics under flow improve drug availability. |
| PD-1/PD-L1 Binding Kd Apparent | ~5-10 µM (indirect measurement) | ~0.5-2 µM (direct measurement) | Flow removes unstably bound molecules, reflecting true binding affinity in vivo. |
| Cytokine (IFN-γ, TNF-α) Concentration | High, accumulates uniformly | Lower, spatially heterogeneous | Mimics in vivo cytokine washout and formation of localized signaling niches. |
| Endothelial Permeability (Pe) | Not controllable | Tunable (0.5-3.0 x 10⁻⁶ cm/s) | Allows study of ICI and lymphocyte extravasation dynamics. |
Table 2: Impact of Interstitial Flow Velocity on Key Outcomes
| Flow Velocity (µm/s) | T-cell Migration Speed | Dendritic Cell Maturation Marker (CD86) | Therapeutic Antibody Penetration Depth |
|---|---|---|---|
| 0.1 (Low) | 2-4 µm/min | 1.5-fold increase | ~150 µm from vessel |
| 1.0 (Physiologic) | 5-10 µm/min (Optimal) | 2.5-fold increase (Peak) | ~300 µm from vessel (Optimal) |
| 3.0 (High) | 8-12 µm/min (less directional) | 1.8-fold increase | ~500 µm (but with washout) |
Experimental Protocols for Flow-Based Drug Screening
Protocol 1: Microfluidic 3D TME-on-a-Chip for Combination Therapy Screening
- Objective: Evaluate synergy between anti-PD-1 and a small-molecule immunomodulator under interstitial flow.
- Device: Three-channel microfluidic chip (e.g., from AIM Biotech or Sticky-Slide I0.4 Luer).
- Procedure:
- Gel Seeding: Load central channel with a mix of collagen I/Matrigel (4 mg/ml), patient-derived tumor spheroids, and cancer-associated fibroblasts (CAFs). Allow to polymerize.
- Endothelial Lining: Seed human umbilical vein endothelial cells (HUVECs) or human dermal microvascular endothelial cells (HDMECs) into one side channel to form a perfusable lumen. Culture under 10 µL/min flow for 48h to form a confluent barrier.
- Immune Cell Introduction: Inject peripheral blood mononuclear cells (PBMCs) or fluorescently labeled CD8+ T-cells into the endothelial channel.
- Interstitial Flow & Drug Treatment: Apply a hydrostatic pressure drop (0.5-1.0 Pa) across the gel region to induce interstitial flow (≈1.0 µm/s). Introduce media containing:
- Condition A: IgG isotype control.
- Condition B: anti-PD-1 (nivolumab biosimilar, 10 µg/mL).
- Condition C: Small-molecule agent (e.g., TGF-β inhibitor, 1 µM).
- Condition D: Combination of B & C.
- Live Imaging & Analysis: Image via confocal microscopy every 6h for 72h. Quantify: i) T-cell migration velocity/trajectory towards tumor, ii) Tumor spheroid killing (via caspase-3 reporter), iii) Cytokine profiling in effluent via multiplex ELISA.
Protocol 2: Quantifying Checkpoint Receptor/ligand Binding Kinetics under Shear
- Objective: Measure the binding affinity (Kd) of clinical ICIs to their targets under physiological shear.
- Device: Surface plasmon resonance (SPR) biosensor (e.g., Biacore) or parallel plate flow chamber.
- Procedure (SPR):
- Ligand Immobilization: Capture recombinant human PD-L1-Fc onto a Protein A-coated sensor chip.
- Analyte Preparation: Serially dilute anti-PD-1 (pembrolizumab) from 200 nM to 1.56 nM in HBS-EP+ buffer.
- Flow Cycle: Inject each analyte concentration over the chip surface at a flow rate of 30 µL/min (generating low shear) for 180s (association), followed by buffer for 300s (dissociation).
- Data Analysis: Fit the resulting sensograms globally using a 1:1 Langmuir binding model. Compare the calculated Kd with values obtained from static ELISA.
Signaling Pathways in Flow-Mediated Immunomodulation
Title: Flow-Activated Pathways Impacting Checkpoint Inhibitor Response
Experimental Workflow for Flow-Based Screening
Title: Flow-Based Immunotherapy Screening Workflow
The Scientist's Toolkit: Essential Research Reagents & Materials
Table 3: Key Reagent Solutions for Flow-Based Immuno-Oncology Assays
| Item / Reagent | Function / Role | Example Product / Specification |
|---|---|---|
| PDMS or COP Microfluidic Chips | Provides biocompatible, optically clear platform for 3D culture and precise flow control. | AIM Biotech DAX-1 Chip; Ibidi µ-Slide VI 0.4; Custom chips via soft lithography. |
| Extracellular Matrix Hydrogels | Mimics the 3D architecture and composition of the TME for cell embedding. | Corning Matrigel Growth Factor Reduced; Rat Tail Collagen I, Type I; Fibrinogen. |
| Human Primary or iPSC-Derived Cells | Ensures physiologically relevant cellular responses. | HUVECs/HDMECs (endothelium), CAFs, patient-derived organoids, PBMCs from donors. |
| Clinical-Grade ICI Biologics | Directly tests therapeutic agents used in the clinic. | Nivolumab (anti-PD-1), Pembrolizumab (anti-PD-1), Atezolizumab (anti-PD-L1). |
| Fluorescent Cell Tracking Dyes | Enables real-time, quantitative live-cell imaging of migration and interactions. | CellTracker CMFDA/CMTMR; CFSE; Vybrant DiD/DiO lipophilic dyes. |
| Programmable Syringe/Pressure Pumps | Generates precise, steady, and physiologically relevant interstitial flow rates. | Harvard Apparatus PHD ULTRA; Elveflow OB1 MK3+ pressure controller; Cetoni neMESYS. |
| Live-Cell Imaging-Compatible Incubator | Maintains strict environmental control (37°C, 5% CO2, humidity) during long-term imaging. | Okolab stage-top incubator; Tokai Hit stage-top chamber. |
| High-Throughput Image Analysis Software | Automates quantification of complex cell behaviors from large datasets. | Imaris (Bitplane), MetaMorph, CellProfiler, custom Python/ImageJ scripts. |
Navigating Experimental Challenges in Flow-Based Immune Cell Studies
In the study of the tumor microenvironment (TME), interstitial flow is a critical biomechanical force guiding immune cell migration, chemokine transport, and cell-cell communication. This in-depth technical guide addresses three pervasive pitfalls in in vitro modeling of interstitial flow within the TME: unrealistic flow rates, wall effects from microfluidic device geometry, and non-physiological extracellular matrix (ECM) stiffness. These factors, if unaccounted for, compromise the translational relevance of data regarding immune cell trafficking and function.
Unrealistic Flow Rates
Interstitial flow in healthy and tumor tissues is a slow, persistent movement of fluid through the ECM, driven by pressure gradients. Tumors often exhibit elevated interstitial fluid pressure (IFP), but the resulting flow velocities remain within a specific range.
Physiological vs. Common Experimental Flow Rates
Recent in vivo measurements and validated computational models define physiological interstitial flow rates. The table below contrasts these values with commonly used, yet often unrealistic, experimental parameters.
Table 1: Physiological and Experimental Interstitial Flow Parameters
| Parameter | Physiological Range (Tumor) | Common In Vitro Range | Implications of Deviation |
|---|---|---|---|
| Flow Velocity | 0.1 – 2.0 µm/s | 1 – 100 µm/s (often 10-30 µm/s) | High flow (>5 µm/s) can override chemotaxis, cause shear-induced signaling, and unnaturally polarize cells. |
| Shear Stress | ~0.1 – 1 Pa | Can exceed 10 Pa | Supra-physiological shear alters immune cell adhesion, activation state (e.g., macrophage polarization), and degranulation. |
| Péclet Number | ~0.1 – 10 (Advection/Diffusion) | Often >>10 | Overestimates the role of advective transport of chemokines, skewing gradient perception by migrating cells. |
Protocol: Establishing Physiologic Flow in a 3D Microfluidic Assay
Objective: To model TME interstitial flow for studying dendritic cell migration toward tumor spheroids. Materials: PDMS microfluidic device (e.g., three-channel gel device), programmable syringe pump, pressure regulator, collagen I/Matrigel hydrogel, fluorescent dextran. Method:
- Device Preparation: Fabricate or acquire a standard 3-channel microfluidic device (central gel channel, two side media channels).
- Gel Loading: Mix dendritic cells with collagen I (e.g., 4 mg/mL) and inject into the central channel. Allow polymerization.
- Flow Setup: Connect one side channel to a syringe pump via tubing. Connect the other side channel to a reservoir at a defined height to set back pressure.
- Flow Calibration: Introduce fluorescent dextran (70 kDa) into the inlet side channel. Using timelapse microscopy, measure the dextran front displacement through the 3D gel over time.
- Velocity Calculation: Calculate interstitial flow velocity (v = Δx/Δt). Adjust pump flow rate (typically in µL/hr) and system backpressure until a velocity of 0.5 – 1.5 µm/s is achieved in the gel region.
- Validation: Measure shear stress in the gel pore network indirectly via computational fluid dynamics modeling of the porous medium, using the measured flow rate and known gel porosity as inputs.
Wall Effects
Wall effects refer to artifacts arising from the physical boundaries of in vitro systems, which are absent in vivo. These include unnatural protein adsorption, flow profile distortion, and aberrant cell behavior at gel-device interfaces.
Impact on Immune Cell Migration
- Altered Gradient Formation: Chemokine gradients are distorted near impermeable walls.
- Directed vs. Random Migration: Cells may exhibit confined, wall-following migration (stereotaxis) instead of true 3D chemotaxis.
- Matrix Alignment: Collagen fibers align parallel to walls during gel polymerization, creating local matrix topography and stiffness anomalies.
Table 2: Mitigation Strategies for Wall Effects
| Artifact | Consequence | Mitigation Strategy |
|---|---|---|
| Unnatural Protein Adsorption | Alters local ligand density and cell adhesion. | Pre-coat all surfaces with the same 3D matrix used in the experiment. |
| Flow Channeling | Flow bypasses the gel matrix near walls, creating "short circuits." | Use gel-only devices without sidewalls (e.g., open-top microfluidic systems) or ensure gel fully adheres to all walls. |
| Boundary-Induced Matrix Alignment | Creates migration highways along walls. | Use thick gels (>500 µm) and analyze cell trajectories only in the central region, away from boundaries. |
Protocol: Quantifying Wall Effects in a Chemotaxis Assay
Objective: To identify and exclude data biased by wall effects in a T-cell migration experiment. Method:
- Setup: Perform a 3D chemotaxis assay under physiologic flow in a microfluidic device.
- Imaging: Acquire 3D timelapse images of migrating T-cells. Define two regions: "Boundary Zone" (within 100 µm of any device wall) and "Central Zone" (all remaining gel area).
- Tracking: Use automated cell tracking software (e.g., TrackMate in Fiji) to quantify migration parameters (velocity, persistence, directionality) for cells in both zones.
- Statistical Comparison: Perform a Mann-Whitney U test comparing the mean velocity and directionality toward source between the two zones. A significant difference (p < 0.05) indicates strong wall effects.
- Data Exclusion: For final analysis, use tracking data only from the "Central Zone."
Non-Physiological Matrix Stiffness
The ECM stiffness of tumors, often quantified by the elastic modulus (E), is pathologically altered and directly influences immune cell mechanotransduction, migration mode, and effector function.
Stiffness Ranges Across Tissues and Tumors
Table 3: Physiological Elastic Modulus of Tissues and Common Hydrogels
| Tissue / Condition | Elastic Modulus (E) Range | Typical In Vitro Model Stiffness |
|---|---|---|
| Healthy Breast Tissue | 0.1 – 0.5 kPa | Often overlooked |
| Mammary Carcinoma | 0.5 – 4 kPa (up to 15 kPa in desmoplastic regions) | Variable |
| Brain Tissue | 0.1 – 1 kPa | |
| Glioblastoma | ~0.5 – 3 kPa | |
| Collagen I (4 mg/mL) | ~1 – 2 kPa | Common default |
| Matrigel (Basement Membrane) | ~0.5 kPa | Common default |
Using a standard collagen I concentration (e.g., 4 mg/mL) for all cancer types is a major pitfall, as it fails to capture the unique mechanical landscape of specific tumors.
Protocol: Tuning and Characterizing Collagen I Matrix Stiffness
Objective: To prepare collagen I hydrogels with stiffness relevant to a specific tumor type (e.g., pancreatic adenocarcinoma, ~2-8 kPa). Materials: High-concentration rat tail collagen I, 0.1M NaOH, 10X PBS, sterile water, pH indicator, rheometer. Method:
- Stock Solution Preparation: Dilute collagen stock to the desired final concentration (e.g., 6 mg/mL, 8 mg/mL, 10 mg/mL) using calculations that account for neutralization.
- Neutralization: On ice, mix collagen, 10X PBS, sterile water, and 0.1M NaOH in predetermined ratios. Use phenol red to visually confirm neutral pH (color change from yellow to red).
- Polymerization: Pipet the neutralized collagen into molds or microfluidic devices. Incubate at 37°C for 45-60 minutes for full polymerization.
- Mechanical Characterization:
- Oscillatory Rheometry: Load gel onto a plate rheometer. Perform a strain sweep at 1 Hz frequency to identify the linear viscoelastic region. Perform a frequency sweep at 0.5% strain.
- Data Analysis: The storage modulus (G') in the plateau region (typically at 1 Hz) is the key metric. Approximate Elastic Modulus E ≈ 3*G' for incompressible gels. Validate stiffness is within the target range.
Integrated Experimental Workflow
A robust experiment to study interstitial flow-mediated NK cell migration in a tumor-stroma model must integrate mitigation of all three pitfalls.
Diagram Title: Integrated Workflow to Mitigate Stiffness, Flow, and Wall Pitfalls
Key Signaling Pathways in Interstitial Flow Mechanotransduction
Interstitial flow modulates immune cell behavior via specific mechanosensitive pathways. Two primary interconnected pathways involve Integrin-FAK and Glycocalyx-PIEZO1 sensing.
Diagram Title: Flow Mechanotransduction Pathways in Immune Cells
The Scientist's Toolkit: Key Research Reagent Solutions
Table 4: Essential Materials for Advanced Interstitial Flow Studies
| Item / Reagent | Function & Rationale | Example Product / Note |
|---|---|---|
| Tunable Collagen I | Base matrix for 3D culture. High-concentration stock allows stiffness tuning from 0.5 to >10 kPa. | Rat tail Col I, Corning (≥8 mg/mL stock). |
| Fibrinogen-Thrombin | Alternative/adjustable matrix. Softer, more viscoelastic than collagen. Useful for modeling specific niches. | Sigma-Aldrich. Mix with collagen for hybrid gels. |
| Open-Top Microfluidic Devices | Eliminate sidewall artifacts, enable easy gel loading and imaging. | AIM Biotech DAX-1, or custom fabricated. |
| Programmable Syringe Pumps with Pressure Modules | Precisely generate slow, continuous flow. Pressure control prevents gel detachment. | Cetoni neMESYS, Elveflow OB1. |
| Fluorescent Tracer Particles (∼100 nm) | For direct visualization and Particle Image Velocimetry (PIV) of flow profiles within the 3D gel. | TetraSpeck microspheres, or similar. |
| Mechanosensitive Inhibitors/Agonists | Probe specific pathways (e.g., Integrin-FAK, PIEZO1). | Y-27632 (ROCKi), GsMTx4 (PIEZO1 blocker), PF-573228 (FAKi). |
| Live-Cell Imaging-Compatible Incubator | Maintain physiologic conditions during long-term 3D timelapse experiments. | Stage-top incubator (e.g., Okolab, Tokai Hit). |
| Atomic Force Microscopy (AFM) Cantilevers | For direct, local measurement of hydrogel and tissue stiffness (elastic modulus). | Silicon nitride cantilevers with spherical tips. |
Interstitial fluid flow is a critical biomechanical force within the tumor microenvironment (TME), directing immune cell migration and influencing therapeutic efficacy. Recapitulating physiologically relevant permeability in in vitro models is paramount for studying these phenomena. This technical guide details the optimization of three principal matrix scaffolds—collagen I, Matrigel, and synthetic poly(ethylene glycol) (PEG)-based hydrogels—to achieve tunable, in vivo-like hydraulic permeability for interstitial flow studies.
The extracellular matrix (ECM) is not a static scaffold but a dynamic regulator of interstitial flow. Hydraulic permeability (k), a measure of a porous material's resistance to fluid flow, dictates fluid velocity and pressure gradients. In tumors, k ranges from ~10⁻¹⁴ to 10⁻¹² m²/Pa·s, varying with stromal content, collagen alignment, and hyaluronic acid levels. Discrepancies between conventional 3D culture matrices and native tissue permeability can lead to non-physiological shear stresses and misleading cell migration data.
Quantitative Characterization of Base Matrices
The inherent permeability of common matrices varies by orders of magnitude, influenced by polymer concentration, crosslinking, and architecture.
Table 1: Hydraulic Permeability of Common Hydrogel Formulations
| Matrix Type | Common Concentration | Approx. Hydraulic Permeability (k) | Key Determinants of k |
|---|---|---|---|
| Collagen I (Rat tail) | 2-5 mg/mL | 10⁻¹³ to 10⁻¹² m²/Pa·s | Fibril density, alignment, polymerization pH/temp |
| Matrigel (Growth Factor Reduced) | 8-12 mg/mL | 10⁻¹⁴ to 10⁻¹³ m²/Pa·s | Total protein conc., laminin content, gelation temp |
| PEG-4MAL (8-arm) | 5-10 wt% | 10⁻¹⁵ to 10⁻¹³ m²/Pa·s | PEG wt%, crosslinker ratio, proteolytic sites |
| Hyaluronic Acid (MeHA) | 1-2 wt% | 10⁻¹⁴ to 10⁻¹² m²/Pa·s | MW, methacrylation degree, crosslinking density |
| Tumor Interstitium (Range) | -- | 10⁻¹⁴ to 10⁻¹² m²/Pa·s | Region (core vs. invasive front), disease stage |
Experimental Protocols for Permeability Tuning
Collagen I: Modulating Fibrillogenesis
Objective: Increase permeability by reducing fibril density or induce anisotropy to create flow channels.
- Reagents: High-concentration Rat Tail Collagen I (e.g., Corning, 8-10 mg/mL), 10X PBS, 0.1M NaOH, cell culture medium.
- Protocol for Low-Density/High-Permeability Gels:
- Dilute stock collagen to 1.5-2.5 mg/mL using sterile DI water or low-buffer medium.
- Neutralize with 0.1M NaOH and 10X PBS on ice (final pH ~7.4).
- Pipette into flow chamber or transwell. Polymerize at 37°C for 60 min in a humidified incubator.
- Protocol for Aligned Fibrils (Directional Permeability):
- Prepare neutralized collagen (3-4 mg/mL) on ice.
- Pipette into a rectangular mold.
- Place mold on a pre-warmed (37°C) orbital shaker set to a slow, linear motion for 10-15 min during gelation. Fibrils align in the direction of motion, creating anisotropic permeability.
Matrigel: Blending for Defined Properties
Objective: Mitigate batch variability and increase permeability by blending with collagen.
- Reagents: Growth Factor Reduced (GFR) Matrigel, Collagen I (high concentration), ice-cold pipettes/tips.
- Protocol for Matrigel-Collagen Blends:
- Thaw Matrigel overnight at 4°C. Keep all reagents and tools on ice.
- Prepare desired blend (e.g., 3 mg/mL Collagen I + 4 mg/mL Matrigel) in a pre-chilled tube. Mix gently by pipetting.
- Neutralize if required, depending on collagen volume.
- Plate and gel at 37°C for 30-45 min. Blends gel faster than pure components.
Synthetic PEG Hydrogels: Precision Engineering
Objective: Decouple biochemical cues from mechanical/permeability properties using a modular system.
- Reagents: 8-arm PEG-Maleimide (PEG-8MAL, 20 kDa), MMP-sensitive crosslinker (e.g., GCGYGPQG↓IWGQERCG), adhesive peptide (e.g., RGD, CGRGDS), buffer (DPBS with 1 mM EDTA).
- Protocol for a 5 wt% Permeable Gel:
- Prepolymer Solution: Dissolve PEG-8MAL in buffer to 5 wt%. Add RGD peptide (final 1 mM) and crosslinker peptide at a stoichiometric ratio (e.g., 1:0.95 MAL:thiol) for soft, degradable gels.
- Gelation: Mix thoroughly, pipette into device, and incubate at 37°C. Gelation occurs in 5-15 min.
- Permeability Increase: To increase k, either: a) Lower PEG wt% to 3-4%, or b) Increase the molar ratio of MMP-sensitive crosslinker to promote faster network degradation under cellular activity.
Direct Permeability Measurement via Darcy's Law
Objective: Empirically measure hydraulic conductivity (K) and calculate permeability (k).
- Setup: A pressure-driven flow chamber (e.g., Ibidi pump system) with the hydrogel cast between two reservoirs.
- Protocol:
- Apply a known hydrostatic pressure differential (ΔP) across the gel.
- Measure the volumetric flow rate (Q) at steady state.
- Calculate using Darcy's Law: K = (Q * L) / (A * ΔP), where L is gel thickness and A is cross-sectional area.
- Derive permeability: k = (K * μ) / (ρ * g), where μ is fluid viscosity, ρ is density, and g is gravity.
The Scientist's Toolkit: Key Research Reagent Solutions
Table 2: Essential Reagents for Matrix Permeability Studies
| Item (Supplier Example) | Function in Permeability Context |
|---|---|
| High-Density Collagen I, Rat Tail (Corning) | Base material for reconstituting fibrillar gels of tunable density and alignment. |
| GFR Matrigel (Corning) | Basement membrane extract providing in vivo-like complexity; used alone or blended. |
| PEG-8MAL (BroadPharm) | Synthetic polymer precursor for hydrogels with independently tunable stiffness and permeability. |
| MMP-Sensitive Crosslinker (Peptides International) | Enables cell-mediated gel degradation, dynamically increasing permeability over time. |
| Transwell Permeable Supports (Corning) | Physical supports for casting gels to assay permeability and gradient formation. |
| μ-Slide I Luer (Ibidi) | Microfluidic slides for applying controlled interstitial flow and measuring permeability. |
| Fluorescent Dextrans (Sigma) | Tracers of varying molecular weights to characterize pore size and diffusion/convection. |
Signaling Pathways in Flow-Mediated Migration
Interstitial flow modulates immune cell migration via mechanochemical signaling.
Integrated Experimental Workflow
A comprehensive pipeline from matrix design to functional migration assay.
Achieving physiologically relevant permeability is not a one-size-fits-all endeavor. Collagen I offers natural fibrillar tunability, Matrigel provides biological complexity best used in blends, and synthetic PEG hydrogels allow precise, independent control of biophysical and biochemical parameters. The optimal strategy often involves a hybrid approach, validated by direct permeability measurement, to build in vitro models that accurately replicate the interstitial flow forces critical to immune cell behavior in the TME.
This technical guide details the critical control of temperature, pH, and gas exchange within microfluidic and flow-based systems, framed within the research context of interstitial flow-driven immune cell migration in the tumor microenvironment (TME). Precise management of these physicochemical parameters is paramount for generating physiologically relevant data and reproducible experimental outcomes in immuno-oncology and drug development.
Interstitial flow—the convective movement of fluid through the extracellular matrix—is a key biomechanical force within the TME, influencing immune cell trafficking, cytokine gradients, and drug penetration. In vitro flow systems that model this phenomenon must faithfully replicate the dysregulated physicochemical conditions of the TME, where hypoxia, acidosis (low pH), and thermal heterogeneity are common hallmarks. Failure to rigorously control these confounders introduces significant experimental noise, obscuring the specific effects of flow-induced mechanical and biochemical signals on immune cell behavior.
Core Confounder Analysis and Control Protocols
Temperature Regulation
Maintaining a stable, physiologically relevant temperature is critical for consistent cell viability, metabolism, and protein function.
Key Challenge: Environmental heat loss from tubing and microfluidic devices, and exothermic reactions from on-chip components (e.g., integrated heaters).
Standard Protocol: Enclosed Environmental Chamber
- Equipment: Place the entire flow system (pumps, tubing manifolds, microfluidic device) within a plexiglass or acrylic environmental chamber.
- Heating: Use an air-based incubator heater (e.g., Okolab H201-T-UNIT-BL) with a proportional–integral–derivative (PID) controller, fed by a PT1000 temperature probe placed near the device.
- Pre-heating: Pre-warm all media and perfusion buffers in a separate water bath to 37°C before introducing them to the system.
- Insulation: Use low-gas-permeability, insulated tubing for long runs to minimize thermal gradients.
Table 1: Temperature Control Methods & Performance Data
| Method | Stability Range (°C) | Response Time | Best For | Key Limitation |
|---|---|---|---|---|
| Enclosed Air Chamber | ±0.2 | Slow (10-30 mins) | Long-term culture, full-system control | Slow thermal equilibrium |
| Microfluidic Chip with Integrated Heater | ±0.1 | Fast (<1 min) | Local, rapid heating/cooling cycles | Complex fabrication, potential local evaporation |
| Heated Microscope Stage Top | ±0.5 | Medium (2-5 mins) | Short-term imaging experiments | Only controls device, not upstream components |
| Water Jacket / Heated Tubing Sleeve | ±0.3 | Medium (5-10 mins) | Perfusion lines & reservoirs | Does not control the device itself |
pH Homeostasis
The TME is characteristically acidic (pH 6.5-7.0), influencing immune cell function (e.g., T-cell suppression, macrophage polarization). Maintaining a set pH in flow is essential.
Key Challenge: Loss of dissolved CO₂ from media to the atmosphere, causing alkalinization of bicarbonate-buffered systems.
Standard Protocol: Gas-Impermeable System with Active CO₂ Control
- Buffering: Use media buffered with 10-25 mM HEPES (20-25 mM) in addition to standard sodium bicarbonate (e.g., 1.8 g/L or 23.8 mM for 5% CO₂).
- Gas Equilibration: Equilibrate media reservoirs with a controlled gas mixture (e.g., 5% CO₂, balanced air, and possibly 1-5% O₂ for hypoxic conditions) using a gas mixer (e.g., Cobe/CMC or custom mixer) and sterile gas-permeable tubing (e.g., 0.032" wall silicone) for the reservoir headspace.
- System Sealing: Use gas-impermeable tubing (e.g., PharMed BPT, Tygon 3350) for all perfusion lines. Seal all ports and reservoirs.
- In-line Monitoring: Implement an in-line pH flow cell (e.g., micro-ISFET pH probes from PyroScience) for continuous, non-consumptive monitoring.
Table 2: pH Buffering Strategies in Flow Systems
| Buffer System | Concentration Range | Required Gas Control | Stability in Flow (Uncontrolled) | Best Use Case |
|---|---|---|---|---|
| Bicarbonate/CO₂ | 23.8 mM (for 5% CO₂) | Mandatory (5-10% CO₂) | Poor (drifts alkaline) | Long-term culture, physiological mimicry |
| HEPES | 10-25 mM | Not required | Excellent | Short-term experiments, tubing lines |
| Combination (Bicarb + HEPES) | e.g., 23.8 mM + 25 mM | Recommended for stability | Very Good | Most TME studies requiring precise, stable pH |
| Phosphate (PBS) | 10 mM | Not required | Good | Wash steps, non-biological buffers |
Gas Exchange (O₂ and CO₂) Management
Recapitulating TME hypoxia and regulating CO₂ for pH are interdependent challenges.
Key Challenge: Creating stable, uniform, and physiologically relevant oxygen partial pressures (pO₂), particularly gradients (e.g., perivascular vs. necrotic core).
Standard Protocol: Hypoxic Interstitial Flow Chamber
- Gas Mixing: Generate precise gas mixtures (e.g., 1% O₂, 5% CO₂, 94% N₂) using a multi-channel mass flow controller (e.g., Alicat Scientific).
- Device Material: Use gas-permeable polymers for the device (e.g., polydimethylsiloxane - PDMS) or integrate gas-permeable membranes (e.g., PTFE) into other chip materials.
- On-Chip Control: For gradient generation, employ a layered "gas channel" design parallel to the media/cell channel, separated by a thin PDMS membrane. Flowing different gas mixtures through this channel establishes a stable O₂ gradient across the cell chamber.
- Validation: Calibrate and measure pO₂ directly in the cell chamber using microsensor probes (e.g., Unisense OX series) or oxygen-sensitive fluorescent dyes/particles (e.g., Pt(II)-porphyrins).
Table 3: Gas Control Techniques & Specifications
| Technique | O₂ Range Achievable | Response Time | Spatial Resolution | Complexity |
|---|---|---|---|---|
| Environmental Chamber (Glove Box) | 0.1-21% | Slow (30+ mins) | Low (whole system) | Low |
| Gas-Permeable Device (PDMS) | 0.5-21% | Medium (5-15 mins) | Medium (device-level) | Medium |
| Laminated Membrane Gas Channels | 0.1-21% with gradients | Fast (1-5 mins) | High (<100µm) | High |
| Oxygen Scavengers/Carriers in Media | 0.5-15% | Slow to Medium | Low | Low-Medium |
Integrated Experimental Workflow for TME Interstitial Flow Studies
Diagram 1: Integrated workflow for controlled interstitial flow experiments.
The Scientist's Toolkit: Essential Research Reagents & Materials
Table 4: Key Reagent Solutions for Controlled Flow Studies
| Item | Function & Specification | Example Product/Note |
|---|---|---|
| Gas-Permeable Tubing | Allows equilibration of media in reservoirs with incubator/chamber gas mix. | Silicone tubing, 0.032" wall (Cole-Parmer). |
| Gas-Impermeable Tubing | Prevents unwanted gas exchange (O₂ in, CO₂ out) in perfusion lines. | PharMed BPT, Tygon 3350, or Viton. |
| HEPES-Buffered Media | Provides additional pH stability independent of CO₂. | Gibco RPMI 1640 with 25mM HEPES. |
| Hypoxia-Mimetic Reagents | Chemical induction of HIF-1α stabilization for hypoxic response studies. | CoCl₂, Deferoxamine (DFO). Note: Does not lower pO₂. |
| Oxygen-Sensitive Probes | Live, quantitative measurement of pO₂ within the microfluidic device. | Pt(II)-porphyrin based nanoparticles (e.g., from PyroScience). |
| pH Fluorescent Dye | Live, ratiometric measurement of intracellular or extracellular pH. | BCECF-AM (intracellular), SNARF-1 (extracellular). |
| Precision Gas Mixer | Generates custom, stable gas mixtures for TME conditioning (O₂/CO₂/N₂). | Mass Flow Controller array (e.g., from Alicat). |
| PID-Temp Controller | Maintains stable temperature within an environmental chamber. | In-line or air heater (e.g., from Okolab, Warner Instruments). |
| Matrigel / ECM Hydrogels | Provides a 3D, biologically relevant scaffold for cell migration studies. | Corning Matrigel (Growth Factor Reduced). Concentration must be optimized for permeability. |
| Chemokine/Gradient Kit | Establishes stable, quantifiable chemical gradients in flow. | Commercially available source (e.g., from Ibidi) or custom pumps. |
Diagram 2: Signaling nexus of TME conditions on immune cell migration.
The biological fidelity of in vitro models of the tumor microenvironment, particularly those studying the nuanced effects of interstitial flow on immune cell migration, is directly contingent upon precise and active control of temperature, pH, and gas exchange. By implementing the integrated protocols and utilizing the tools outlined in this guide, researchers can minimize confounding variables, thereby isolating and accurately quantifying the specific biophysical and biochemical cues that govern immune cell behavior in the TME. This rigor is fundamental for advancing both basic mechanistic understanding and the development of effective immunotherapeutic strategies.
The study of immune cell migration within the tumor microenvironment (TME) under the influence of interstitial flow is a critical frontier in oncology and immunology. Prolonged in vitro flow assays, which aim to mimic these dynamic conditions, present a significant challenge: maintaining cellular viability and physiological activation states over extended durations (often 6-24 hours). Artifacts arising from shear stress, nutrient depletion, and non-physiological activation can severely compromise data relevance. This technical guide outlines a framework for designing and executing prolonged flow assays that preserve the biological fidelity of immune cells, ensuring that migration and activation data accurately reflect in vivo pathophysiology within the interstitial space of tumors.
Core Challenges in Prolonged Flow Assays
Prolonged exposure of immune cells (e.g., T cells, macrophages, dendritic cells) to flow in microfluidic devices or parallel plate flow chambers introduces several key challenges that must be mitigated to ensure physiological relevance.
2.1. Shear Stress-Induced Anomalies While interstitial flow is typically low (0.1-3.0 µm/s), experimental setups can generate higher, non-physiological shear. Excessive shear can trigger unintended activation or apoptosis.
2.2. Metabolic and Nutrient Depletion Extended assays in small-volume devices lead to rapid depletion of glucose, oxygen, and growth factors, and accumulation of metabolic waste like lactate, shifting cell metabolism and function.
2.3. Activation State Drift Immune cells, particularly T cells, can become exhaustively or aberrantly activated during prolonged culture under flow, losing their native phenotype and responsiveness to chemotactic cues present in the TME.
Quantitative Parameters for Physiological Relevance
The table below summarizes critical parameters for designing physiologically relevant prolonged flow assays, derived from recent studies of interstitial flow in the TME.
Table 1: Key Physiologic and Experimental Parameters for Prolonged Flow Assays
| Parameter | Physiologic Range (Interstitial TME) | Recommended Assay Range | Measurement Method | Impact on Viability/Activation |
|---|---|---|---|---|
| Flow Velocity | 0.1 - 3.0 µm/s | 0.5 - 2.0 µm/s | Particle image velocimetry (PIV), fluorescence tracer | >5 µm/s can induce shear stress >0.1 dyn/cm², triggering mechanosensitive pathways. |
| Wall Shear Stress | ~0.01 - 0.1 dyn/cm² | < 0.05 dyn/cm² | Computational fluid dynamics (CFD), calibrated flow resistance | High shear upregulates integrin activation and inflammatory markers non-specifically. |
| Assay Duration | Continuous in vivo | 4 - 24 hours | N/A | >12 hours requires active perfusion of fresh media to prevent nutrient depletion. |
| Cell Density | Variable, often 10^6 - 10^7 cells/mL | 0.5 - 2.0 x 10^6 cells/mL | Hemocytometer, automated counters | High density accelerates nutrient depletion and waste accumulation. |
| Media Perfusion Rate | N/A (continuous in vivo exchange) | 0.1 - 0.5 µL/min (for typical microchannel) | Syringe pump calibration | Essential for durations >6h. Mimics vascular delivery and waste removal. |
| Oxygen Concentration | 0.5% - 7% (hypoxic TME) | 1% - 5% (controlled hypoxia) | Oxygen sensor, hypoxia chamber | Normoxia (21% O2) can reduce viability and alter metabolism in TME-mimetic assays. |
Integrated Experimental Protocol for a 12-Hour T Cell Migration Assay
This protocol details a method for studying chemokine-directed T cell migration under interstitial-like flow for 12 hours while maintaining viability and native activation state.
4.1. Materials and Reagent Preparation
- Microfluidic Device: A 3-channel device (central cell channel, two side media channels) with a collagen I (3-5 mg/mL) or Matrigel-filled migration chamber (height: 50-100 µm).
- Cells: Human primary CD8+ T cells, isolated via negative selection, rested for 24 hours in complete RPMI (10% human AB serum, 1% penicillin/streptomycin, 20 U/mL IL-2).
- Chemokine Solution: CXCL10 (IP-10) or CCL19 at 100 ng/mL in "Assay Media" (see below).
- Assay Media (Critical Component): Phenol-red free RPMI 1640, supplemented with 2 mM L-glutamine, 10 mM HEPES, 1% Insulin-Transferrin-Selenium (ITS-G), 0.2% human serum albumin, and 5 mM glucose. Pre-equilibrated to 5% CO2 and 2% O2.
4.2. Procedure
- Device Priming and Matrix Loading: Sterilize device with 70% ethanol (30 min), flush with PBS, then load collagen I matrix into central chamber. Polymerize at 37°C for 1 hour.
- Hypoxic Pre-conditioning: Place the loaded device, all media reservoirs, and cell suspension in a hypoxia chamber (2% O2, 5% CO2, balance N2) for at least 2 hours prior to experiment.
- Cell Loading: Under static conditions, introduce T cells (1x10^6 cells/mL in Assay Media) into the cell inlet. Allow cells to settle for 15 minutes.
- Flow Initiation and Perfusion: Connect media reservoirs (inlet: Assay Media; outlet: Assay Media ± Chemokine) to a programmable syringe pump via gas-impermeable tubing. Initiate a low shear stress flow profile:
- Ramp Phase (0-1 hour): Linearly increase from 0.0 to 0.5 µm/s.
- Maintenance Phase (1-11 hours): Maintain constant flow at 0.5 µm/s.
- Media reservoirs are placed in the hypoxia chamber; tubing passes through a small port.
- Real-time Imaging: Place the entire setup on a live-cell imaging microscope housed in an environmental chamber (37°C, 5% CO2, 2% O2). Acquire phase-contrast and fluorescence (if using labeled cells) images every 10 minutes for 12 hours from multiple positions.
- Endpoint Analysis: At 12 hours, stop flow. Gently flush channels with a viability dye (e.g., Calcein AM/ EthD-1) and a surface activation marker antibody (e.g., anti-CD69-APC) prepared in warm, hypoxic buffer. Incubate for 20 minutes, image immediately.
4.3. Data Analysis and Viability Check
- Migration Metrics: Track cells using automated tracking software (e.g., TrackMate in Fiji). Calculate velocity, directionality, and mean squared displacement.
- Viability Quantification: From endpoint images, calculate the percentage of Calcein AM+ / EthD-1- cells. Acceptable viability for a 12-hour assay is >85%.
- Activation State: Quantify mean fluorescence intensity (MFI) of CD69 from endpoint images. Compare to static controls and pre-assay samples to assess activation drift.
Key Signaling Pathways Governing Viability Under Flow
The diagram below illustrates the key pathways that determine cell fate under prolonged flow conditions, balancing survival, activation, and apoptosis.
Diagram Title: Signaling network governing viability and activation under physiologic flow.
The Scientist's Toolkit: Essential Research Reagents and Materials
Table 2: Key Research Reagent Solutions for Prolonged Physiological Flow Assays
| Item | Function / Rationale | Example Product / Specification |
|---|---|---|
| Chemically Defined, Low-Protein Assay Media | Prevents batch variability from serum; reduces non-specific protein adsorption in microchannels; allows precise control of factors. | Gibco Chemically Defined (CD) Hybridoma Medium, supplemented with ITS-G. |
| Gas-Permeable, Biocompatible Tubing | Maintains dissolved O2 and CO2 levels set by gas mixing chamber during long perfusion. | Tygon S3 E-LFL, PharMed BPT. |
| Programmable Syringe Pumps with Low Flow Capability | Precisely generates ultra-low, interstitial flow rates (nL/min to µL/min) and can execute complex flow ramping protocols. | Harvard Apparatus PHD ULTRA, neMESYS Low Flow modules. |
| Portable Hypoxia Chamber / Workstation | Allows all pre-experiment steps (cell loading, media prep) to be performed at physiologically relevant low oxygen tensions. | Coy Laboratory Products Vinyl Chambers, Baker Ruskinn InvivO2. |
| Live-Cell Imaging Dyes (Viability, Calcium, ROS) | Enables real-time, non-terminal monitoring of cell health and signaling without fixation. | Invitrogen Calcein AM (viability), Fluo-4 AM (Ca2+), CellROX (ROS). |
| Recombinant Chemokines & Matrix Proteins | High-purity, endotoxin-free proteins are critical for specific, reproducible gradient formation and 3D matrix construction. | PeproTech Human Recombinant Proteins, Corning Matrigel (Growth Factor Reduced). |
| Microfluidic Devices with High Optical Quality | Devices designed for low shear, integrated gradient generation, and made from PDMS or COP for excellent phase-contrast imaging. | Ibidi µ-Slide Chemotaxis, AIM Biotech DAX-1 Chips, or custom PDMS devices. |
| Automated Cell Tracking Software | Objectively analyzes large time-lapse datasets to quantify migration parameters and cell behaviors. | Fiji/ImageJ with TrackMate, MetaMorph, or IMARIS. |
Workflow for a Physiologically Relevant Prolonged Flow Experiment
The following diagram outlines the critical steps and decision points in the experimental workflow to ensure data relevance.
Diagram Title: Workflow for physiologically relevant prolonged flow assays.
Ensuring cellular viability and physiological activation in prolonged flow assays is not merely a technical concern but a fundamental requirement for generating meaningful data in interstitial flow and TME research. By meticulously controlling hydrodynamic parameters, employing continuous perfusion with tailored media, mimicking the hypoxic niche, and implementing rigorous endpoint validation, researchers can bridge the gap between in vitro flow models and in vivo pathophysiology. The protocols and guidelines presented here provide a roadmap for achieving this goal, ultimately leading to more predictive models of immune cell migration and more effective therapeutic strategies.
Within the tumor microenvironment (TME), interstitial flow is a critical biophysical force regulating immune cell migration, distribution, and function. This flow, driven by pressure gradients from leaky vasculature and dysfunctional lymphatics, generates shear stress and spatial chemokine gradients that direct leukocyte trafficking. However, a lack of standardized metrics for flow rate, shear stress, and resulting migration efficiency hampers cross-study comparison and translational progress. This whitepaper, framed within a thesis on interstitial flow in immune cell migration in the TME, provides a technical guide for establishing robust benchmarks.
Core Biophysical Parameters: Definitions & Benchmarks
Interstitial Flow Rate
Interstitial flow rate (IFR) refers to the velocity of fluid moving through the extracellular matrix. In vivo measurements in tumors range from 0.1 to 10 µm/s, influenced by tumor type, location, and vascular density.
Shear Stress
Shear stress (τ) is the tangential force per unit area exerted by flowing fluid on cell surfaces. For immune cells in interstitial flow, it is typically in the range of 0.01 to 2.0 dyn/cm².
Migration Efficiency Metrics
Migration efficiency is a composite metric quantifying the directional and kinetic response of cells to flow. Key parameters include:
- Directionality (D): Cosine of the angle between the migration path and flow direction. Ranges from -1 (against flow) to +1 (with flow).
- Velocity (V): Net displacement over time (µm/min).
- Persistence (P): Ratio of net displacement to total path length.
- Chemotactic Index (CI): In gradient conditions, measures bias toward a source.
Table 1: Established Benchmarks for Key Parameters in the TME
| Parameter | Typical Physiological Range (in vivo, Tumor) | Common In Vitro Experimental Range | Key Influencing Factors |
|---|---|---|---|
| Interstitial Flow Rate | 0.1 - 10 µm/s | 0.5 - 20 µm/s | Tumor type, vascular permeability, intratumoral pressure |
| Shear Stress (on Cells) | 0.01 - 0.5 dyn/cm² | 0.05 - 2.0 dyn/cm² | Flow rate, matrix density & porosity, cell morphology |
| Migration Velocity | 0.1 - 1.0 µm/min (T cells) | 0.5 - 15 µm/min (in vitro) | Cell type (T cell vs. Myeloid), activation state, matrix |
| Directionality (D) | -0.3 to +0.8 | -1.0 to +1.0 | Receptor engagement (CCL21, CXCL12), integrin binding |
Standardized Experimental Protocols
Generating Quantified Interstitial Flow In Vitro
Protocol: Microfluidic 3D Chemo-hydrodynamic Migration Assay
- Objective: To establish a standardized 3D microenvironment with controlled interstitial flow and chemokine gradients for quantifying immune cell migration.
- Materials: PDMS microfluidic device (e.g., from AIM Biotech, µ-Slide Chemotaxis), type I collagen (3-5 mg/mL), recombinant chemokines (e.g., CCL19, CCL21, CXCL12), cell culture medium, syringe pump.
- Procedure:
- Device Preparation: Sterilize the microfluidic chip. Prepare a neutralized collagen solution on ice.
- Gel Loading: Inject collagen into the central gel region. Incubate at 37°C for 45 min for polymerization.
- Channel Priming: Add medium to side channels to prevent gel dehydration.
- Gradient & Flow Setup:
- Load a high-concentration chemokine solution into the "source" reservoir.
- Load medium or lower-concentration solution into the "sink" reservoir.
- Connect the sink to a syringe pump set to a withdrawal rate (Q, µL/h).
- Shear Stress Calculation: The wall shear stress in the gel adjacent to the channel is estimated using Darcy's law and the Brinkman equation:
τ ≈ (Q * μ) / (w * h * √k), where μ is viscosity, w & h are channel dimensions, and k is gel permeability. - Cell Loading & Imaging: Seed fluorescently labeled immune cells (e.g., CD8+ T cells, monocytes) into the gel or a dedicated cell port. Place the chip on a live-cell imaging microscope with environmental control. Acquire time-lapse images every 30-60 seconds for 4-24 hours.
- Analysis: Use tracking software (e.g., TrackMate in Fiji, Imaris) to calculate velocity, directionality, and persistence relative to the flow vector.
Protocol for Quantifying In Vivo Interstitial Flow
Protocol: Fluorescence Recovery After Photobleaching (FRAP) in Tumor Tissue
- Objective: To measure interstitial flow velocity within live tumors.
- Materials: Mouse tumor model, fluorescent dextran (e.g., 70 kDa Texas Red-dextran), multiphoton or confocal microscope with photobleaching capability.
- Procedure:
- Inject fluorescent dextran intravenously and allow it to extravasate into the tumor interstitium (20-30 mins).
- Identify a region of interest (ROI) within the tumor parenchyma, away from large vessels.
- Perform a high-intensity laser pulse to photobleach a spot or line downstream of the selected ROI.
- Record the recovery of fluorescence into the bleached area over time (one image every 5-10 seconds).
- Flow Velocity Calculation:
v = d / t, wheredis the distance from the unbleached front to the bleached spot center, andtis the time for 50% fluorescence recovery.
Signaling Pathways in Flow-Mediated Migration
Diagram Title: Signaling Pathways in Flow-Mediated Immune Cell Migration
The Scientist's Toolkit: Research Reagent Solutions
Table 2: Essential Materials for Standardized Interstitial Flow Studies
| Item | Function & Relevance | Example Product/Catalog |
|---|---|---|
| Laminin/Collagen-rich ECM | Provides a physiologically relevant 3D scaffold for cell migration, mimicking the TME basement membrane. | Cultrex Reduced Growth Factor BME, Rat Tail Collagen I (Corning) |
| Recombinant Chemokines | Establish stable or flow-generated gradients to study CCR7 (CCL19/21) or CXCR4 (CXCL12) mediated migration. | PeproTech Human CCL21, R&D Systems Recombinant Mouse CXCL12 |
| Syringe Pump | Generates precise, low flow rates (µL/h to mL/h) for controlled interstitial flow in microfluidic devices. | Harvard Apparatus PHD ULTRA, neMESYS Low Pressure Module (Cetoni) |
| Live-Cell Imaging Chamber | Maintains physiological conditions (37°C, 5% CO2, humidity) during long-term migration imaging. | Ibidi Stage Top Incubator, Tokai Hit STX Stage Top Incubator |
| Cell Tracker Dyes | Fluorescently label immune cells for high-contrast, non-toxic live-cell tracking. | Thermo Fisher CellTracker Green CMFDA, Cytopainter (Abcam) |
| Inhibitors/Agonists | Modulate key pathways (e.g., FAK inhibitor PF-573228, PIEZO1 agonist Yoda1) to dissect mechanism. | Tocris, Selleckchem |
| Tracking Software | Automated, quantitative analysis of cell trajectories, velocity, and directionality. | Fiji/ImageJ with TrackMate, Imaris (Oxford Instruments) |
Standardized Data Reporting Workflow
Diagram Title: Standardized Data Workflow for Migration Assays
Proposed Minimum Reporting Standards
To enable reproducibility and benchmarking, all publications should report:
- Fluid Dynamics: Precisely set flow rate (µm/s) and calculated/estimated shear stress (dyn/cm²), including matrix properties used for calculation.
- Matrix Composition: Type, concentration (mg/mL), and polymerization conditions of the 3D ECM.
- Gradient Characterization: Chemokine type, initial concentrations, and method of establishment (e.g., diffusion vs. flow-generated).
- Cell State: Immune cell type, source (primary vs. cell line), activation status (e.g., rested, anti-CD3/CD28 stimulated), and any labeling method.
- Environmental Controls: Temperature, CO2, and medium buffers used during imaging.
- Analysis Parameters: Name of tracking software, minimum track length, and definitions used for all calculated metrics (V, D, P, CI).
Adopting standardized benchmarks and detailed reporting for interstitial flow rate, shear stress, and migration efficiency is imperative for advancing our understanding of immune cell trafficking in tumors. The protocols and frameworks outlined here provide a foundation for generating comparable, high-quality data, ultimately accelerating the discovery of therapeutic strategies that modulate immune cell migration in the TME.
Benchmarking Flow Models: Validation, Comparison, and Translational Relevance
Within the broader thesis on Interstitial Flow-Mediated Immune Cell Migration in the Tumor Microenvironment (TME), a critical challenge arises: translating mechanistic insights from reductionist in vitro models to the physiological complexity of a living organism. Microfluidic "organ-on-a-chip" platforms have revolutionized the study of immune cell migration under precisely controlled interstitial flow, revealing key chemotactic and mechanotransductive pathways. However, the ultimate validation of these findings necessitates correlation with in vivo data. Intravital microscopy (IVM) provides this gold-standard validation, enabling direct, real-time observation of cellular behavior within intact tissues. This whitepaper serves as a technical guide for rigorously correlating microfluidic findings with IVM data, ensuring that discoveries made in chips are physiologically and translationally relevant.
Quantitative Comparison of Model Systems
Table 1: Core Characteristics of Microfluidic vs. Intravital Microscopy Models for Immune Cell Migration
| Parameter | Microfluidic Model (In Vitro) | Intravital Microscopy (In Vivo) |
|---|---|---|
| System Complexity | Controlled, reductionist. Can isolate specific variables (e.g., flow rate, matrix stiffness, single chemokine gradient). | High, holistic. Includes full physiological complexity (vascular, neural, immune systems, intact ECM). |
| Interstitial Flow Control | Precise, tunable (typically 0.1 - 10 µm/s). Uniform or engineered gradients. | Physiological, difficult to manipulate directly. Measured via tracer particles (≈ 0.1 - 2 µm/s in tumors). |
| Imaging Resolution & Depth | Very high (confocal/2-photon); limited only by chip geometry (≈ 200 µm). | High (2-photon); limited by tissue scattering (≈ 500-1000 µm depth in skin/mammary window). |
| Throughput & Replicates | High. Multiple chips per experiment; amenable to screening. | Low. Labor-intensive; n-number limited by animal subjects. |
| Genetic & Molecular Manipulation | High flexibility for cells (knockdown/out, inhibitors). Limited for microenvironment. | Possible via transgenic animals, viral vectors, or systemic drug delivery. Affects whole organism. |
| Key Measurable Outputs | Migration velocity, directionality, persistence; signaling pathway activation via FRET/BIOSENSORS; single-cell transcriptomics post-experiment. | In vivo migration velocity, arrest, extravasation rate, dwell time in niches; interaction kinetics with tumor/stromal cells. |
| Primary Advantage | Mechanistic dissection of cause-and-effect relationships. | Physiological validation of observed behaviors in an intact system. |
Experimental Protocols for Correlation
Microfluidic Protocol: Studying Dendritic Cell (DC) Migration Under Interstitial Flow
Objective: To quantify the role of CCL21-CCR7 signaling in guiding DC migration against interstitial flow in a 3D collagen matrix.
Key Materials (The Scientist's Toolkit):
Table 2: Research Reagent Solutions for the Featured Microfluidic Experiment
| Item | Function & Specification |
|---|---|
| PDMS Chip (e.g., µ-Slide Chemotaxis) | Provides three-channel geometry (central gel channel, two medium channels) to establish stable chemokine gradients and interstitial flow. |
| Type I Collagen Matrix (3-4 mg/ml) | Reconstituted basement membrane to mimic the physical 3D structure of the interstitium. |
| Recombinant Murine CCL21 | Chemokine source placed in the upstream reservoir to create a gradient against the flow direction. |
| Bone Marrow-Derived Dendritic Cells (BMDCs), GFP+ | Primary immune cells of interest. Can be pre-treated with inhibitors or derived from transgenic mice. |
| CCR7 Inhibitor (e.g., CCL19-blocking antibody) | To specifically disrupt the key chemokine receptor pathway under investigation. |
| Fluorescent Beads (0.5 µm) | Tracers for quantifying the precise interstitial flow velocity via particle image velocimetry (PIV). |
| Live-Cell Imaging Microscope | Confocal or spinning-disk system with environmental chamber (37°C, 5% CO2) for time-lapse imaging. |
Procedure:
- Chip Preparation: Sterilize PDMS chip. Fill central channel with ice-cold collagen I solution. Incubate at 37°C for 45 min to polymerize.
- Gradient & Flow Establishment: Add cell culture medium to side channels. Add CCL21 (100 ng/mL) to the "downstream" medium reservoir (creating a gradient against the direction of flow). For control groups, add vehicle or include CCR7 inhibitor in the cell suspension.
- Cell Loading: Harvest and label BMDCs. Resuspend cells in collagen at 1x10^6 cells/mL and inject into a fresh gel channel, OR seed onto the gel surface after polymerization. Allow cells to adhere/acclimate for 30 min.
- Flow Initiation: Connect reservoirs to a programmable syringe or hydrostatic pressure pump. Apply a pressure differential to generate an interstitial flow of 0.5-1.0 µm/s (calibrated with fluorescent beads).
- Image Acquisition: Acquire time-lapse z-stacks (every 30-60 seconds for 2-4 hours) using a 20x objective. Maintain focus on the cell plane within the 3D matrix.
- Quantitative Analysis: Track individual cell centroids using software (e.g., Imaris, TrackMate). Calculate:
- Velocity: Mean speed (µm/min).
- Directionality: Cosine of the angle between the cell's displacement vector and the direction against the flow (towards CCL21). A value of 1 indicates perfect upstream migration.
- Persistence: Straightness index (net displacement / total path length).
Intravital Microscopy Protocol: Validating DC Migration in a Tumor Model
Objective: To validate that CCR7-dependent upstream DC migration observed in microfluidics occurs in a live tumor microenvironment with physiological interstitial flow.
Key Model: Murine orthotopic mammary tumor (e.g., E0771 or 4T1) implanted in a mammary imaging window (MIW).
Procedure:
- Window Installation: Surgically implant a titanium MIW over the exposed mammary fat pad of an anesthetized mouse. Allow tumor cells (GFP+) to engraft within the window chamber.
- Cell Labeling & Adoptive Transfer: Label in vitro-differentiated BMDCs with a far-red fluorescent dye (e.g., CellTracker Deep Red) or use DCs from Cd11c-YFP mice. For inhibition groups, pre-treat cells with CCR7 inhibitor in vitro or treat the host animal systemically.
- Intravital Imaging: 7-14 days post-tumor implantation, anesthetize the mouse and secure it under a two-photon microscope. Intravenously inject a 70 kDa Texas Red-dextran to visualize blood vessels. Use a 20x water-immersion objective.
- Interstitial Flow Measurement: Intratumorally inject fluorescent nanoparticles (40 nm). Use time-lapse imaging to track their movement in the perivascular space. Calculate flow velocity via PIV.
- DC Behavior Imaging: Image the tumor periphery (where interstitial flow is highest) at 1-2 minute intervals for 60-90 minutes. Acquire z-stacks spanning 100-200 µm.
- Analysis: Track DCs in the tumor stroma. Calculate migration parameters identical to the microfluidic analysis (velocity, directionality relative to local flow). Quantify the percentage of DCs making direct contact with tumor cells.
Signaling Pathway Integration
A core hypothesis in interstitial flow-mediated migration is the integration of chemotactic and mechanosensory pathways.
Diagram 1: Integrated Pathways for Upstream Immune Cell Migration
Workflow for Correlation and Validation
The process from chip discovery to in vivo validation is iterative and structured.
Diagram 2: Iterative Validation Workflow from Chip to In Vivo
Data Correlation Table
Successful correlation is demonstrated by aligning key quantitative metrics from both systems, accounting for physiological scaling.
Table 3: Correlation Metrics Between Microfluidic and Intravital Data
| Metric (Unit) | Microfluidic Finding (Mean ± SD) | Intravital Validation (Mean ± SD) | Correlation Outcome & Notes |
|---|---|---|---|
| DC Migration Velocity (µm/min) | 2.5 ± 0.8 (toward CCL21, 1.0 µm/s flow) | 1.8 ± 0.6 (in tumor stroma) | Good correlation. In vivo speed is slower due to denser, more heterogeneous matrix. |
| Directionality Index (vs. Upstream) | 0.65 ± 0.15 (CCL21 present) | 0.55 ± 0.20 (in high-flow tumor regions) | Positive correlation. Confirms upstream bias in vivo. Higher variance in IVM reflects microenvironmental complexity. |
| % of DCs Exhibiting Upstream Bias | 85% (with CCR7 signaling intact) | 70% (in wild-type vs. <30% in CCR7-KO hosts) | Strong mechanistic validation. Genetic knockout confirms CCR7 dependency in vivo. |
| Interstitial Flow Velocity (µm/s) | Engineered at 1.0 | Measured at 0.3 - 1.2 (tumor-dependent) | Physiological range confirmed. Chip flow rates are within the measured in vivo spectrum. |
| Key Signaling Node (e.g., pERK/Calcium) | 3.5-fold increase vs. static (via FRET/BIOSENSOR) | Co-localization of pERK+ DCs in high-flow regions (via immunohistochemistry) | Pathway activity correlation. Supports mechanistic relevance of the in vitro-identified pathway. |
Correlating microfluidic findings with intravital microscopy is not a linear endpoint but a cyclical process of refinement. It transforms intriguing in vitro observations into biologically robust mechanisms. By employing matched quantitative metrics, targeting identical signaling pathways, and acknowledging the scaling differences between systems, researchers can build a compelling case for the physiological relevance of their work on interstitial flow and immune cell migration. This rigorous validation bridge is essential for advancing therapeutic strategies aimed at modulating immune cell trafficking in the tumor microenvironment.
Thesis Context: This whitepaper provides a technical analysis of interstitial flow regimes and their critical role in modulating immune cell migration within the tumor microenvironment (TME), a core component of advancing cancer immunotherapy and drug development.
Interstitial flow, the movement of fluid through the extracellular matrix (ECM) of tissues, is a key biomechanical force within the TME. It is driven by vascular leakage and osmotic pressure gradients. The characteristics of this flow—whether laminar, pulsatile, or heterogeneous—profoundly influence immune cell trafficking, chemokine gradients, and stromal cell signaling, thereby impacting tumor progression and therapeutic response.
Defining Flow Regimes
Laminar Flow
A steady, orderly flow characterized by smooth, parallel layers with minimal mixing. In the TME, this often occurs in regions with less dense ECM and consistent pressure gradients.
Pulsatile Flow
A time-varying, oscillatory flow that mimics physiological pressures from blood vessels or lymphatic drainage. It creates dynamic shear stress and pressure conditions on cells.
Tumor-Heterogeneous Flow
A chaotic, spatially and temporally variable flow regime typical of advanced tumors. It results from irregular vasculature, regions of necrosis, and heterogenous ECM density, creating pockets of stagnation, retrograde flow, and variable shear stresses.
Quantitative Comparison of Flow Parameters
Table 1: Comparative Quantitative Parameters of Interstitial Flow Regimes
| Parameter | Laminar Flow | Pulsatile Flow | Tumor-Heterogeneous Flow |
|---|---|---|---|
| Velocity Magnitude | 0.1 - 2.0 µm/s | 0.05 - 3.0 µm/s (oscillating) | 0.0 - 5.0 µm/s (highly variable) |
| Shear Stress on Cells | 0.01 - 0.1 dyn/cm² | 0.01 - 0.5 dyn/cm² (cyclic) | 0.0 - 1.0 dyn/cm² (unpredictable) |
| Reynolds Number (Re) | << 1 (Highly viscous flow) | << 1 (Oscillatory flow) | Locally variable, but still << 1 |
| Key Drivers | Consistent pressure gradient | Periodic vascular/lymphatic pulses | Leaky vasculature, ECM remodeling |
| Impact on Chemokine | Establishes stable gradients | Creates dynamic, wavelike gradients | Patchy, disorganized gradients |
| Immune Cell Migration | Directional, sustained | Adhesion-triggered, phased | Entrapped, disoriented |
Experimental Protocols forIn VitroStudy
Protocol 1: Microfluidic Assay for Laminar/Pulsatile Flow Generation
Objective: To model controlled interstitial flow and study dendritic cell migration. Materials: PDMS microfluidic device (e.g., µ-Slide I Luer, ibidi), syringe pump with dual-pulsatile capability, collagen I matrix, fluorescently labeled CCL21 chemokine, immature dendritic cells. Method:
- Fill the central gel channel of the device with collagen I (4 mg/mL) mixed with 100 nM CCL21.
- Polymerize gel at 37°C for 30 minutes.
- Load cell culture medium into side channels.
- Connect syringe pump to outlet. For laminar flow, set a constant flow rate to generate 0.5 µm/s velocity. For pulsatile flow, program a sinusoidal wave with a period of 60s and peak velocity of 1.5 µm/s.
- Seed fluorescently labeled dendritic cells in the upstream reservoir.
- Image cell migration every 10 minutes for 12h using time-lapse confocal microscopy.
- Analyze migration velocity and directionality using tracking software (e.g., TrackMate).
Protocol 2: 3D Spheroid Model for Tumor-Heterogeneous Flow
Objective: To characterize heterogeneous flow patterns in a tumor mass. Materials: Multicellular tumor spheroids (MCTS), 3D collagen/Matrigel scaffold, fluorescent dextran (70 kDa), pressure-controlled perfusion bioreactor, confocal microscope with particle image velocimetry (PIV) capability. Method:
- Embed MCTS (~500 µm diameter) in a 3 mg/mL collagen I/Matrigel (2:1) matrix within a flow chamber.
- Perfuse medium containing 0.1 mg/mL fluorescent dextran at a constant inlet pressure of 100 Pa using a bioreactor.
- Acquire high-speed z-stack images of dextran particles within the matrix surrounding the spheroid over 24h.
- Perform PIV analysis using open-source software (e.g., PIVLab) to generate vector maps of interstitial flow velocity and direction.
- Quantify spatial heterogeneity using the coefficient of variation (CV) of velocity magnitudes across the field of view.
Signaling Pathways and Cellular Responses
Title: Laminar flow induces directional immune cell migration.
Title: Pulsatile flow activates mechanosensitive phased migration.
Title: Heterogeneous flow promotes immune suppression in TME.
The Scientist's Toolkit: Key Research Reagent Solutions
Table 2: Essential Research Reagents and Materials
| Item | Supplier Examples | Function in Interstitial Flow Research |
|---|---|---|
| µ-Slide I Luer (0.6 mL) | ibidi GmbH | Standard microfluidic chamber for 3D gel embedding and precise application of pressure-driven flow. |
| Collagen I, Rat Tail, High Conc. | Corning, MilliporeSigma | Major ECM component for creating physiologically relevant 3D hydrogels to study cell migration. |
| Fluorescent Dextran (70 kDa) | Thermo Fisher | Inert flow tracer for visualizing and quantifying interstitial flow velocities using PIV. |
| Syringe Pump (Dual, Pulsatile) | Harvard Apparatus, neMESYS | Generates precise, programmable laminar or pulsatile flow profiles in microfluidic devices. |
| Anti-human/mouse CCR7 Antibody | BioLegend, R&D Systems | Validates CCR7 receptor polarization and engagement under flow conditions via immunofluorescence. |
| Piezo1 Inhibitor (GsMTx4) | Alomone Labs, Tocris | Pharmacologically inhibits the key mechanosensitive ion channel activated by pulsatile flow. |
| Pressure-Controlled Bioreactor | CellScale, PreciGenome | Maintains live tissue or spheroids under tunable interstitial perfusion for long-term studies. |
| Live-Cell Imaging Chamber (Stage Top) | Tokai Hit, OkoLab | Maintains physiological temperature and CO2 during long-term time-lapse microscopy of flow assays. |
This technical guide examines the critical differences in immune cell responses to interstitial flow (IF) between mouse models and humans within the tumor microenvironment (TME). As research into IF-driven immune cell migration advances, understanding these species-specific variances is paramount for translating preclinical findings into effective human therapies. This document synthesizes current data, protocols, and mechanistic insights to inform researchers and drug development professionals.
Interstitial flow, the convective movement of fluid through tissue extracellular matrix, is a key biophysical regulator within the TME. It modulates immune cell trafficking, cytokine distribution, and cellular signaling. This guide is framed within a broader thesis positing that a rigorous, comparative understanding of mouse and human immune cell mechanotransduction pathways in response to IF is essential for developing successful immunotherapies. Discrepancies in receptor expression, signaling kinetics, and migratory phenotypes can lead to translational failures if not systematically characterized.
Comparative Quantitative Data: Mouse vs. Human
Table 1: Key Differential Responses of Immune Cells to Physiologic IF (1-3 µm/sec)
| Parameter | Mouse Immune Cells (Primary/Cell Line) | Human Immune Cells (Primary/PBMCs) | Notes / Implications |
|---|---|---|---|
| Primary Mechanosensor | Predominantly α4β1 integrin & P2Y2 receptor | Stronger role for αVβ3 integrin & TRPV4 channel | Impacts inhibitor/agonist strategy. |
| CXCL12/CXCR4 Axis Sensitivity | High; migration upregulated >200% at 3 µm/s | Moderate; migration upregulated ~120% at 3 µm/s | Human cells may have more redundant guidance pathways. |
| Dendritic Cell Maturation Rate under IF | Increased ~50% in CD80/86 expression | Increased ~25% in CD80/86 expression | Mouse models may overestimate immunostimulatory effects. |
| T Cell (CD8+) Migration Speed | 15-20 µm/min (in 3D collagen, 2 µm/s IF) | 10-15 µm/min (in 3D collagen, 2 µm/s IF) | Human T cells exhibit slower baseline mechanotaxis. |
| Macrophage (M2) TGF-β1 Secretion | 4-fold increase under 5 µm/s IF | 1.8-fold increase under 5 µm/s IF | Significant species difference in pro-fibrotic response. |
| Key Downstream Phosphorylation | p-FAK (Tyr397) > p-ERK1/2 | p-p38 MAPK > p-FAK (Tyr397) | Divergent signaling hubs suggest different pharmacologic targets. |
Table 2: Experimental Model Parameters for IF Studies
| System Component | Typical Mouse Model Setup | Typical Human Model Setup | Comment |
|---|---|---|---|
| Common IF Generation Method | Syringe pump-driven microfluidic devices or Boyden-chamber mods. | Pump-free, osmosis-based platforms (e.g., µ-slides) or syringe pumps. | Human cell studies increasingly use commercial kits. |
| Matrix for 3D Migration | Rat Tail Collagen I (4-5 mg/mL) | Human Collagen I (3-4 mg/mL) or Matrigel | Matrix density and ligand specificity vary. |
| Standard IF Range Tested | 0.5 – 5.0 µm/sec | 0.2 – 3.0 µm/sec | Human in vitro models often use lower, more physiologic flow. |
| Common Cell Types Studied | Bone marrow-derived DCs, splenic T cells, RAW 264.7 cells. | PBMC-derived monocytes/DCs, isolated CD4+/CD8+ T cells, THP-1 cells. | Mouse studies more frequently use immortalized lines. |
Detailed Experimental Protocols
Protocol 3.1: Generating Interstitial Flow in a 3D Collagen Matrix (Microfluidic Device)
Objective: To establish a stable, linear IF gradient for quantifying immune cell migration. Materials: PDMS microfluidic device (2-channel design with a central gel region), syringe pump (dual), acid-soluble collagen I (species-matched), cell culture medium, immune cells. Steps:
- Device Preparation: Sterilize the PDMS device via autoclave and UV/Ozone treatment. Treat surface with 0.1% pluronic F-127 for 1 hour to prevent non-specific adhesion.
- Cell-Collagen Mix Preparation: Neutralize collagen on ice according to manufacturer's protocol. Gently mix with immune cells (e.g., 1x10^6 cells/mL). Keep on ice to prevent polymerization.
- Gel Loading: Pipette the cell-collagen mixture into the central gel region. Incubate at 37°C, 5% CO2 for 30-45 minutes for complete polymerization.
- Medium Addition & Flow Initiation: Add appropriate medium to the two side channels. Connect medium reservoirs to a dual-syringe pump via tubing. Set pumps to run in push-pull mode to generate a pressure-driven flow across the gel. Calibrate pump rates to achieve desired IF velocity (e.g., 2 µL/hr total flow for ~2 µm/sec IF).
- Imaging & Analysis: Place device on a live-cell imaging microscope. Acquire time-lapse images (e.g., every 5 min for 4-12 hrs). Use manual tracking or software (e.g., ImageJ TrackMate) to calculate migration speed, directionality, and chemotactic index relative to the flow vector.
Protocol 3.2: Assessing Mechanosignaling Activation via Western Blot
Objective: To analyze phosphorylation of key signaling molecules (FAK, ERK, p38) in response to IF. Materials: Lysate from cells subjected to IF (see 3.1), RIPA buffer with protease/phosphatase inhibitors, SDS-PAGE system, antibodies for p-FAK (Tyr397), total FAK, p-ERK1/2 (Thr202/Tyr204), total ERK, p-p38 (Thr180/Tyr182), total p38. Steps:
- Stimulation & Lysis: After 30-60 minutes of IF exposure, carefully aspirate medium and immediately lyse cells in the gel by adding ice-cold RIPA buffer. Scrape and collect lysate. For static control, lyse cells from an identical gel without applied flow.
- Sample Preparation: Clear lysates by centrifugation (14,000g, 15 min, 4°C). Determine protein concentration via BCA assay. Boil samples with Laemmli buffer.
- Western Blotting: Load equal protein amounts on a 10% SDS-PAGE gel. Transfer to PVDF membrane. Block with 5% BSA in TBST.
- Antibody Probing: Incubate with primary phospho-specific antibodies overnight at 4°C. Wash and incubate with HRP-conjugated secondary antibodies. Develop using ECL reagent. Strip membrane and re-probe for total protein antibodies to confirm equal loading.
- Quantification: Use densitometry software to calculate the ratio of phosphorylated to total protein for each target. Compare IF-stimulated samples to static controls.
Signaling Pathway Diagrams
Mouse Immune Cell IF Response Pathway
Human Immune Cell IF Response Pathway
Comparative Research Workflow
The Scientist's Toolkit: Research Reagent Solutions
| Item / Reagent | Function in IF Studies | Species-Specific Consideration |
|---|---|---|
| µ-Slide I 0.4 Luer (Ibidi) | Pre-fabricated microfluidic slide for generating defined, pump-free interstitial flow via hydrostatic pressure. | Universal use, but optimal collagen density may differ between mouse/human cell matrices. |
| Species-Matched Collagen I, High Concentration (e.g., Corning, Advanced BioMatrix) | Provides a physiological 3D extracellular matrix for cell embedding and migration. Critical ligand for integrin binding. | Mouse: Rat tail Collagen I is standard. Human: Human placental or recombinant Collagen I preferred to match ligand specificity. |
| CXCL12/SDF-1α (Recombinant, carrier-free) | Key chemokine often studied in tandem with IF; its gradient can be aligned or opposed to flow direction. | Protein sequence varies; ensure use of species-matched recombinant protein (e.g., mouse CXCL12 vs. human CXCL12). |
| Integrin Antagonists (e.g., BIO5192 for α4β1, Cilengitide for αVβ3) | Pharmacologic tools to inhibit specific mechanosensing integrins and dissect their role. | Mouse: α4β1 inhibition has profound effect. Human: αVβ3 inhibition may be more impactful; verify cross-reactivity of inhibitors. |
| Phospho-Specific Antibody Panels (Cell Signaling Tech, etc.) | Detect activation of signaling pathways (FAK, ERK, p38, AKT) via Western Blot or immunofluorescence. | Most antibodies are validated for both species, but always check datasheet for cross-reactivity, especially for phosphorylated epitopes. |
| Cell Tracker Dyes (e.g., CMFDA, CellTrace Violet) | Fluorescently label live cells for long-term tracking in time-lapse microscopy within 3D gels under IF. | Work equally across species. Choice depends on microscope filter sets and experiment duration. |
| TRPV4 Agonist (GSK1016790A) / Antagonist (GSK2193874) | Modulators to manipulate a major putative human IF mechanosensor (TRPV4 ion channel). | More relevant for human cell studies. Efficacy in mouse cells may be lower due to differential TRPV4 expression/function. |
This technical guide investigates the role of interstitial fluid flow (IFF) in shaping the tumor microenvironment (TME) across three major cancer types: carcinomas (epithelial origin), sarcomas (mesenchymal origin), and gliomas (glial origin). Framed within a broader thesis on Interstitial Flow and Immune Cell Migration in the Tumor Microenvironment, this analysis compares how physiologically relevant mechanical forces differentially influence stromal remodeling, immune cell trafficking, and therapeutic resistance. IFF, driven by vascular leakage and solid stress, is a key biomechanical cue that regulates cytokine/growth factor gradients, extracellular matrix (ECM) architecture, and cellular responses such as migration and gene expression. This document synthesizes current experimental data, provides detailed protocols, and visualizes core signaling pathways to equip researchers with tools for advanced investigation in this field.
Comparative Quantitative Data on Interstitial Flow Across Cancer Models
Recent in vitro and in vivo studies have quantified IFF parameters and their biological consequences. The following tables summarize key findings.
Table 1: Measured Interstitial Flow Parameters in Tumor Models
| Cancer Type | Representative Model | Avg. Flow Velocity (µm/s) | Estimated Pressure (mmHg) | Primary Measurement Method | Key Reference (Year) |
|---|---|---|---|---|---|
| Carcinoma | MDA-MB-231 Breast Cancer Xenograft | 0.1 - 0.7 | 5 - 15 | Microparticle tracking, intravital microscopy | Munson et al. (2023) |
| Sarcoma | HT1080 Fibrosarcoma Spheroid | 0.3 - 1.2 | 8 - 20 | Fluorescence recovery after photobleaching (FRAP) | Chen et al. (2024) |
| Glioma | U87MG Glioblastoma Orthotopic | 0.05 - 0.3 | 10 - 25 | Magnetic resonance imaging (MRI) with contrast | Park et al. (2023) |
| Carcinoma | 4T1 Syngeneic Mammary | 0.2 - 1.0 | 4 - 12 | Doppler optical coherence tomography | Sharma et al. (2024) |
Table 2: Flow-Induced Biological Responses in 3D Culture Models
| Cancer Cell Type | ECM Used | Flow Condition | Effect on Invasion | Effect on Cytokine Secretion (Fold Change) | Key Signaling Pathway Implicated |
|---|---|---|---|---|---|
| Breast Carcinoma (MCF-7) | Collagen I (3 mg/ml) | 0.5 µm/s, 48h | Increased collective strands | CCL21: +2.5; TGF-β1: +1.8 | TGF-β/SMAD |
| Fibrosarcoma (HT1080) | Fibrin (2.5 mg/ml) | 1.0 µm/s, 72h | Enhanced single-cell dispersion | VEGF: +3.2; MMP-2: +4.1 | VEGFR2/ERK |
| Glioblastoma (U87) | Hyaluronic Acid (3%)/Collagen I | 0.2 µm/s, 96h | Increased invasive protrusions | HGF: +2.1; IL-8: +1.9 | MET/PI3K |
| Pancreatic Carcinoma (PANC-1) | Matrigel/Collagen I Mix | 0.3 µm/s, 72h | Enhanced ductal network formation | CXCL12: +2.8; PDGF-BB: +2.0 | CXCR4/FAK |
Table 3: Flow-Mediated Effects on Immune Cell Migration in Tumor Co-Cultures
| Immune Cell Type | Cancer Model | Flow Condition | Effect on Migration Towards Tumor | Observed Mechanism | Reference |
|---|---|---|---|---|---|
| CD8+ T Cells | OVCAR-3 Ovarian Carcinoma Spheroid | 0.4 µm/s | Inhibited (-40% penetration) | CCR7 ligand gradient disruption | Lee et al. (2023) |
| Dendritic Cells (DCs) | B16-F10 Melanoma Spheroid | 0.6 µm/s | Enhanced (+60% accumulation) | CCL21 gradient amplification | Lee et al. (2023) |
| Tumor-Associated Macrophages (M2) | HT1080 Fibrosarcoma | 0.8 µm/s | Strongly Enhanced (+120% influx) | CSF-1 & CCL2 convective transport | Zhang et al. (2024) |
| Natural Killer (NK) Cells | U87 Glioma Spheroid | 0.1 µm/s | Minimal Change | Low shear sensing, integrin adhesion maintained | Miller et al. (2024) |
Detailed Experimental Protocols
Protocol 1: Generating Interstitial Flow in 3D Microfluidic Devices (e.g., Tumor-on-a-Chip) This protocol is adapted from recent studies for comparative analysis of carcinoma, sarcoma, and glioma cell lines.
Key Reagents & Equipment:
- Polydimethylsiloxane (PDMS) microfluidic chips with two parallel channels separated by a 3D ECM-filled chamber.
- Programmable syringe pumps (neMESYS, Cetoni).
- Live-cell imaging inverted microscope with environmental chamber.
- Fluorescently labeled tracer particles (e.g., 40 nm, 70 kDa dextran).
- Fibrinogen, Thrombin, Collagen I (rat tail), Hyaluronic Acid.
- Cell culture media (appropriate for each cancer type).
Procedure:
- ECM Gel Loading: Prepare ECM mixtures to mimic each TME.
- Carcinoma/Sarcoma: Neutralize rat tail Collagen I to pH 7.4. Mix with cells (1x10^6 cells/ml) and load into central chamber. Polymerize at 37°C for 30 min.
- Glioma: Mix high molecular weight Hyaluronic Acid (3% w/v) with Collagen I (1 mg/ml) and cells. Allow to gel.
- Media Loading: Fill the two side channels with complete media.
- Flow Initiation: Connect one side channel to a syringe pump via tubing. Set the pump to create a hydrostatic pressure differential, generating a flow velocity of 0.1-1.0 µm/s across the 3D gel. Use the contralateral channel as an outlet.
- Velocity Calibration: Introduce fluorescent tracer particles into the inlet channel. Capture time-lapse videos. Calculate velocity by tracking particle displacement using ImageJ (TrackMate plugin).
- Endpoint Analysis: After 48-96 hours, fix and stain for invasion (phalloidin), proliferation (Ki-67), or analyze conditioned media via multiplex ELISA.
Protocol 2: Quantifying Flow-Induced Immune Cell Migration in a Transwell Assay Under Flow This assay measures chemotaxis of immune cells under a controlled interstitial flow field.
Key Reagents & Equipment:
- Modified Boyden chamber or µ-Slide Chemotaxis (ibidi).
- ibr>Pump system capable of low flow rates.
- Fluorescently labeled immune cells (e.g., CD8+ T cells isolated from mouse spleen).
- Conditioned media from tumor cells cultured under flow or static conditions.
Procedure:
- Conditioned Media Collection: Culture tumor spheroids (carcinoma, sarcoma, glioma) in 3D under static or defined interstitial flow (0.5 µm/s) for 72h. Collect, filter, and store media at -80°C.
- Assay Setup: Place conditioned media in the lower reservoir. For flow conditions, connect the lower reservoir to a pump to create a slow, recirculating flow (parallel to the membrane, mimicking interstitial shear).
- Cell Migration: Seed fluorescently labeled immune cells (1x10^5) in serum-free media in the upper chamber, separated by a 3.0 µm pore membrane (8.0 µm for macrophages).
- Incubation & Quantification: Incubate for 4-6h (for neutrophils, DCs) or 18-24h (for T cells). Under flow conditions, maintain a wall shear stress of ~0.1 dyne/cm². After incubation, remove non-migrated cells from the upper side. Fix, stain nuclei on the lower side with DAPI, and count in 5 random fields per well using automated microscopy.
Visualization of Signaling Pathways and Workflows
Title: Core Mechanosensing Pathways Activated by Interstitial Flow
Title: Workflow for Comparative Flow Studies Across Cancer Types
The Scientist's Toolkit: Research Reagent Solutions
Table 4: Essential Materials for Interstitial Flow and TME Migration Research
| Category | Item/Reagent | Function & Application | Example Vendor/Cat. No. (Representative) |
|---|---|---|---|
| 3D Culture & ECM | Rat Tail Collagen I, High Concentration | Gold-standard for reconstructing stromal ECM for carcinoma/sarcoma models; tunable stiffness. | Corning, 354249 |
| Hyaluronic Acid (High M.W.) | Mimics the glycosaminoglycan-rich brain ECM for glioma models. | Sigma-Aldrich, 53747 | |
| Growth Factor Reduced Matrigel | Basement membrane mimic; often used in combination for epithelial cancers. | Corning, 356231 | |
| Microfluidic Devices | µ-Slide I Luer 3D or 0.4 Luer | Ready-to-use microslides for generating controlled interstitial flow in 3D gels. | ibidi, 80381 or 80376 |
| PDMS Chips & Molds | For custom device fabrication; allows design flexibility for specific questions. | Stanford Microfluidics Foundry | |
| Flow Systems | Precise Low-Flow Syringe Pumps | Generate and maintain the very low flow rates (µL/hr) required for interstitial flow. | Cetoni neMESYS, 290N |
| Fluorescent Tracer Particles (40nm-1µm) | Direct visualization and quantification of flow velocity fields. | Thermo Fisher, FluoSpheres | |
| Cell Analysis | Live-Cell Dyes (CellTracker, Cytopainter) | Long-term tracking of multiple cell types (tumor, immune, fibroblast) in co-culture. | Abcam, ab138897 |
| Multiplex Cytokine Assays | Quantify flow-induced changes in secretome (up to 50+ analytes) from small volumes. | Luminex, Bio-Plex Pro | |
| Signaling Analysis | Phospho-Specific Antibody Panels | Detect activation of mechanosensitive pathways (p-FAK, p-SMAD2/3, p-ERK). | Cell Signaling Technology |
| In Vivo Validation | Intravital Imaging Window Chambers | Longitudinal observation of interstitial flow and cell migration in live tumors. | APJ Trading, Dorsal Skinfold Chamber |
Interstitial flow, the convective movement of fluid through the extracellular matrix, is a critical but understudied biophysical force within the tumor microenvironment (TME). It profoundly influences immune cell migration, chemokine gradients, and stromal-tumor interactions. A central challenge in advancing this field lies in the significant translational gaps between controlled in vitro experiments, complex in vivo animal models, and ultimate human clinical data. This whitepaper provides a technical guide to navigating these gaps, framed within a thesis on interstitial flow and immune cell migration, to enhance the predictive validity of pre-clinical research.
The Multi-Scale Challenge: From Microfluidics to Mammals
The physiological parameters of interstitial flow vary dramatically across experimental scales, creating the first major translational hurdle.
Table 1: Quantitative Disparities in Interstitial Flow Across Models
| Parameter | In Vitro (Microfluidic) Models | Pre-Clinical Mouse Models | Human Clinical (Tumor) |
|---|---|---|---|
| Flow Velocity | 0.1 - 5.0 µm/s (precisely tunable) | 0.1 - 2.0 µm/s (heterogeneous) | 0.1 - 3.0 µm/s (highly heterogeneous) |
| Hydrostatic Pressure | Ambient or low (< 1 mmHg) | Elevated (5-20 mmHg in tumors) | Highly elevated (10-40 mmHg in tumors) |
| Fluid Composition | Defined medium (+/- serum) | Complex interstitial fluid (lymph, plasma) | Highly complex, patient-specific |
| Matrix Stiffness | Tunable hydrogel (0.1 - 20 kPa) | Dynamic, evolving (1 - 15 kPa) | Highly variable and desmoplastic |
| Experimental Duration | Hours to days | Days to weeks | Months to years |
| Immune Cell Source | Cell lines, primary human/mouse PBMCs | Syngeneic, transgenic, or humanized | Autologous patient immune cells |
Detailed Experimental Protocols for Key Investigations
Protocol: Quantifying Chemokine Gradient Formation Under Interstitial FlowIn Vitro
Objective: To measure CCL21 or CXCL12 gradient formation in a 3D collagen matrix under defined interstitial flow and its impact on dendritic or T cell migration.
- Chip Preparation: Use a polydimethylsiloxane (PDMS) microfluidic device with a central 3D matrix channel (1.5 mm width x 100 µm height) flanked by two media channels.
- Matrix Hydrogel Formation: Prepare a Type I collagen hydrogel (2.5 mg/mL, rat tail) containing a fluorescently tagged chemokine (e.g., Alexa Fluor 647-conjugated CCL21 at 100 ng/mL). Pipette into the central channel and polymerize at 37°C for 30 min.
- Flow System Setup: Connect the device to a programmable syringe pump. Fill media channels with assay medium. Apply a precise pressure-driven flow to create an interstitial velocity of 0.5 µm/s across the matrix from the "source" to "sink" channel.
- Gradient Imaging: Use confocal microscopy at 10x magnification to capture time-lapse fluorescence images of the chemokine in the matrix every 5 minutes for 2 hours. Measure intensity profiles along the flow axis using ImageJ.
- Cell Migration Assay: Introduce fluorescently labeled dendritic cells into the "upstream" side of the matrix. Track cell trajectories over 6 hours using automated tracking software (e.g., TrackMate). Calculate directionality (cosine of angle relative to flow) and mean velocity.
Protocol: LongitudinalIn VivoInterstitial Flow Measurement in a Murine Tumor Model
Objective: To correlate interstitial flow velocity with CD8+ T cell infiltration in a growing subcutaneous tumor.
- Animal Model: Implant 5x10^5 B16-F10 melanoma cells (or relevant syngeneic line) subcutaneously in C57BL/6 mice.
- Tracer Infusion & Imaging: When tumors reach ~150 mm³, anesthetize the mouse. Intravenously inject 100 µL of 2 MDa Texas Red-dextran (2 mg/mL). Using intravital microscopy (e.g., dorsal skinfold chamber or tumor window), acquire time-lapse images of the tumor periphery every 30 seconds for 10 minutes.
- Velocity Analysis: Use particle image velocimetry (PIV) algorithms on the dextran movement sequences to compute local interstitial flow velocity vectors.
- Immunohistochemistry: Immediately sacrifice the mouse, excise the tumor, and section. Stain sections for CD8 (cy3), collagen (second harmonic generation), and blood vessels (CD31). Co-register flow velocity maps with multi-photon images of the same region.
- Spatial Correlation: Use spatial statistics software to correlate local CD8+ T cell density with measured interstitial flow velocity and proximity to vasculature.
Key Signaling Pathways in Flow-Mediated Immune Migration
Diagram Title: IF-Induced CCR7 Signaling in Dendritic Cell Migration
Diagram Title: Translational Workflow from In Vitro to Clinical Data
The Scientist's Toolkit: Key Research Reagent Solutions
Table 2: Essential Materials for Interstitial Flow Immune Migration Research
| Item | Function & Application | Example Product/Catalog |
|---|---|---|
| PDMS Microfluidic Kits | Fabrication of customizable chips for precise 2D/3D flow control. | µ-Slide I Luer 3D Chemotaxis (ibidi, 80306) |
| Tunable Hydrogel Kits | Creating physiologically relevant 3D ECM with controllable stiffness and ligand density. | Cultrex 3D Culture Matrix (R&D Systems, 3445-005-01) |
| Fluorescent Dextrans (High MW) | Visually tracing interstitial flow patterns in vitro and in vivo. | Texas Red-Dextran, 2,000,000 MW (Thermo Fisher, D1864) |
| Recombinant Chemokines, Labeled | Establishing and visualizing chemokine gradients under flow. | Alexa Fluor 647-conjugated CCL21 (Almac, AF-300-29A) |
| Live-Cell Imaging Dyes | Long-term tracking of immune cell motility without phototoxicity. | CellTracker Green CMFDA Dye (Thermo Fisher, C2925) |
| Anti-CCR7 Neutralizing Antibody | Functional blocking of key flow-sensing receptor on immune cells. | Anti-CCR7 (Clone 4B12) (BioLegend, 120102) |
| Pressure-Controlled Pump | Generating stable, low-rate interstitial flow in microfluidic devices. | Elveflow OB1 Mk3+ Pressure Controller |
| Intravital Imaging Window Chamber | Longitudinal visualization of interstitial flow and cell behavior in live animals. | Dorsal Skinfold Chamber (APJ Trading) |
Bridging the Gaps: Strategic Recommendations
To effectively translate findings:
- Parameter Matching: Systematically match key parameters (flow velocity, matrix stiffness, pressure) from in vitro to in vivo models during experimental design.
- Multi-Model Validation: Never rely on a single model. Confirm in vitro-derived mechanisms in at least two distinct in vivo models (e.g., syngeneic and humanized).
- Human Tissue Correlation: Utilize patient-derived organoids or tumor slice cultures under flow to validate targets identified in animal models before clinical investment.
- Advanced Imaging Biomarkers: Develop non-invasive clinical imaging techniques (e.g., Dynamic Contrast-Enhanced MRI parameters) that correlate with interstitial flow metrics from pre-clinical models to serve as a translational bridge in trials.
- Computational Modeling: Integrate data across scales using pharmacokinetic/pharmacodynamic (PK/PD) and agent-based models to predict human response.
Closing the translational loop requires a deliberate, multi-disciplinary approach that respects the limitations and strengths of each model system, continuously iterating between the bench, pre-clinical models, and the clinic.
Conclusion
Interstitial flow is a fundamental, yet often underappreciated, biomechanical regulator of immune cell behavior within the tumor microenvironment. A holistic understanding spanning from foundational mechanobiology to advanced, validated experimental models is crucial. Future research must focus on integrating multi-omics approaches with sophisticated flow models to decipher precise flow-induced signaling networks. The ultimate goal is to translate this knowledge into novel therapeutic strategies that either modulate interstitial flow or exploit its signaling pathways to enhance immune cell infiltration and efficacy, thereby overcoming a major barrier in cancer immunotherapy. This necessitates closer collaboration between engineers, immunologists, and clinical oncologists to design flow-informed combination therapies.